Contributors

Subscribe to our newsletter
This study demonstrates a procedure following which you can calibrate a set of IoT sensors, Arable Mark VI (image below) for instance, to satellite imagery on an example of a commercial growers’ cornfield in Illinois, US. [image]
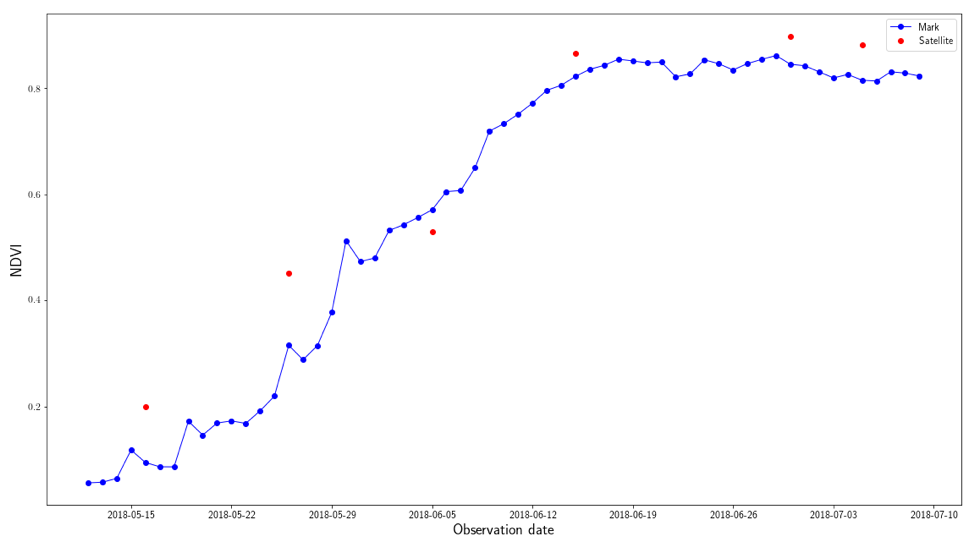
The dataset in the study comprised of NDVI daily readings from Arable Mark VI and calculated for Sentinel 2 imagery over 11 days. Out of these 11 days, satellite imagery only for 6 of them is usable due to cloud cover.
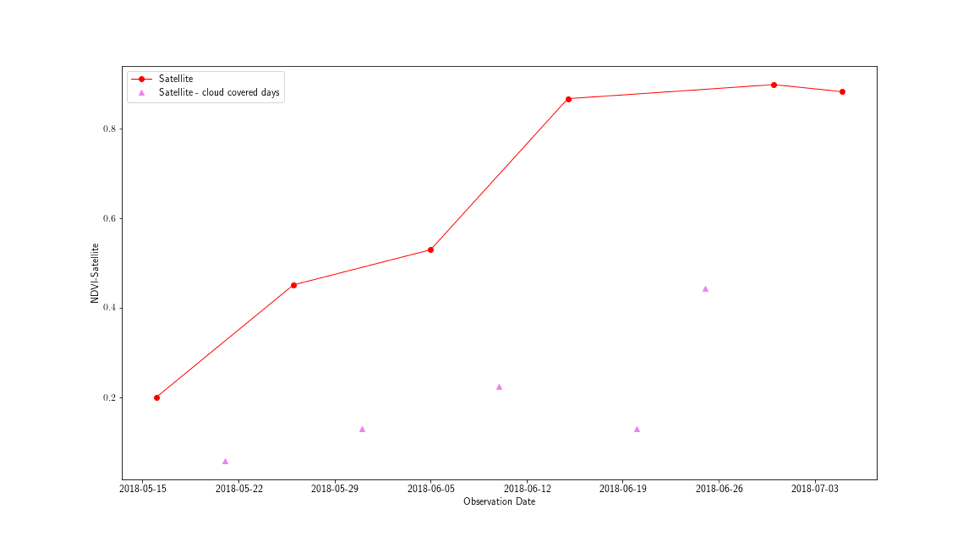
The lack of clear satellite data - the key rationale for the study
Achieving reliable calibration between an IoT device and satellite imagery allows for optimal spatial and temporal coverage of the data. Having interoperable datasets allows the growers and crop advisors to support applications of fertilisers or chemicals across the field with optimal rates at any given point in the season, regardless of the availability of the satellite imagery, simply based on the IoT device readings and spatial field patterns from previous remote sensing images. This scenario, of course, does not account for any unexpected events that would significantly change in-field variabilities, like hail, frost or disease/pest.
Daily data from 2018-05-12 00:00:00 to 2018-07-09 00:00:00 (local time zone) is retrieved from Arable API in CSV format and the NDVI values are compared with the satellite indices.
Before calibrating the indices from satellite, few statistical parameters that show the current errors in satellite indices data (extent of deviation from IoT sensor data) are calculated using the following relations.
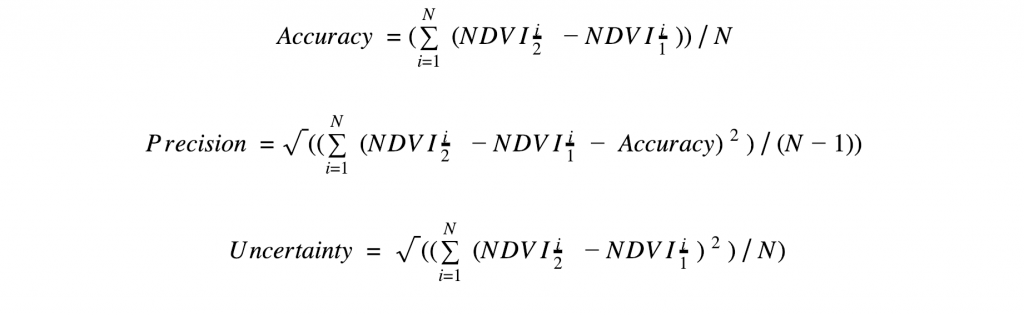
If A ≠ 0, there’s systematic bias. When we perform calibration, P →0 ensures that there’s good NDVI consistency. Before calibration, these parameters are A = 0.0606, P = 0.0607, U (error) = 0.0821 (8.21%) for satellite index values.
For those of you who are interested, you can try these two simple methods of calibration: linear and quadratic regressions. We applied the regressions for the data over 6 non-cloudy days and you can see the result below.
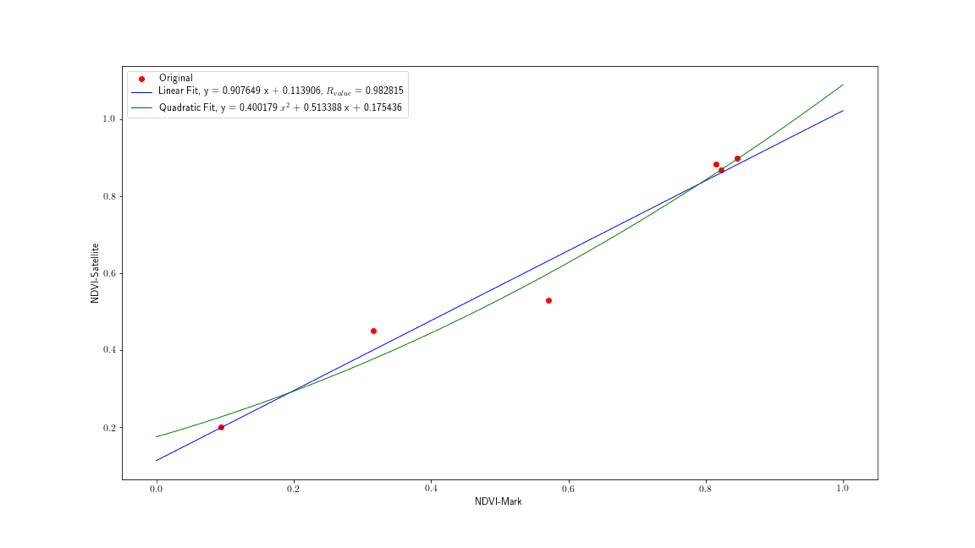
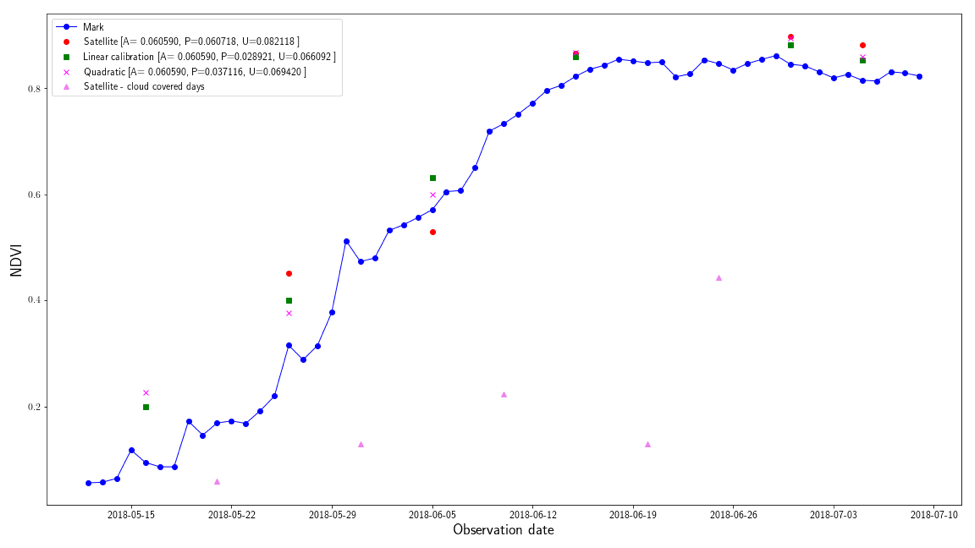
New calibrated values of NDVI values for satellite are plotted using both regression methods (green and pink symbols) along with their accuracy, precision and uncertainty. It can be seen that in this case, linear regression provides better results with lower uncertainty.
The method of calibration used here is crude since the NDVI values utilised for calibration are from one location (over multiple observation days). Whereas cross-calibration of two or more sensors is usually attempted for one common date over a spatial area spread through different classes of vegetation. More imagery data points (satellite or aerial) per date could help better calibrate each index on a day.
The Results
Using the regression method, the satellite index values can be fairly accurately calibrated with IoT sensor readings with a correlation coefficient (R-value) of 0.9828. Using the linear regression, the uncertainty in the values was reduced from 8.21% to 6.60%. For the current study, however, the extent of calibration (reduction of bias from the system) is lower due to lack of usable data points (only 6 out of 11 days).
Here, we performed the calibration of NDVI sensor readings for the same location (in the field) over multiple days (temporal analysis). However, the spatial cross-calibration of sensors for one particular observation date may result in even better correlation between the two sensors (IoT and Sentinel satellite). Given data samples from satellite and Mark, correlations can be drawn and the sensors can be calibrated using the presented method.
The plots comparing the NDVI maps of the mark for 4 fields are included below.
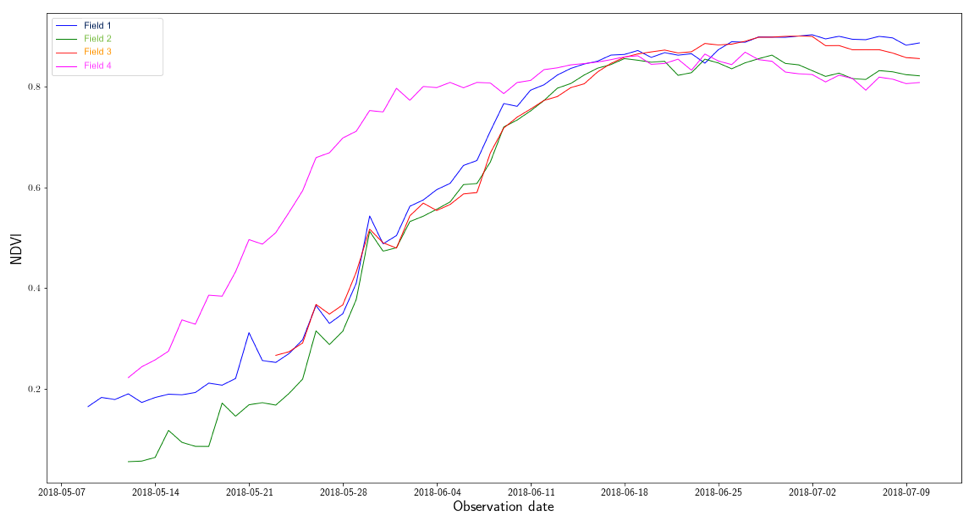
Note that Field 4 (in pink) has a different progression of NDVI values as a result of an earlier sowing date for the season (by almost 2 weeks) compared to other fields.
Both satellite and Mark can be used together to make up for the days or spatial locations that are missing data by having a calibrated relation that predicts them. The limitations of temporal resolution, cloud cover affecting data acquisition etc. for satellites, and limitations of IoT sensors to cover variations of vegetation over the entire field can be reduced by optimizing the incorporation of the relationship between the data from two sensors.
Placement of the IoT sensors is a task elegantly handled by the function for placement of the TSP points in FluroSense software. Try it to determine best placement for your IoT devices or simply when you go tissue testing next.