Contributors

Subscribe to our newsletter
See the invisible.
Use this tool to identify anomalies in your field, track field trial progress, detect crop stress and damage. You can also map permanent features like pivots, roads or waterways.
Time to read: 2 mins.
Automatically detect anomalies with Satellite imagery
Select the anomaly tool located on the left-hand side. The stressed areas will be automatically populated on your field.
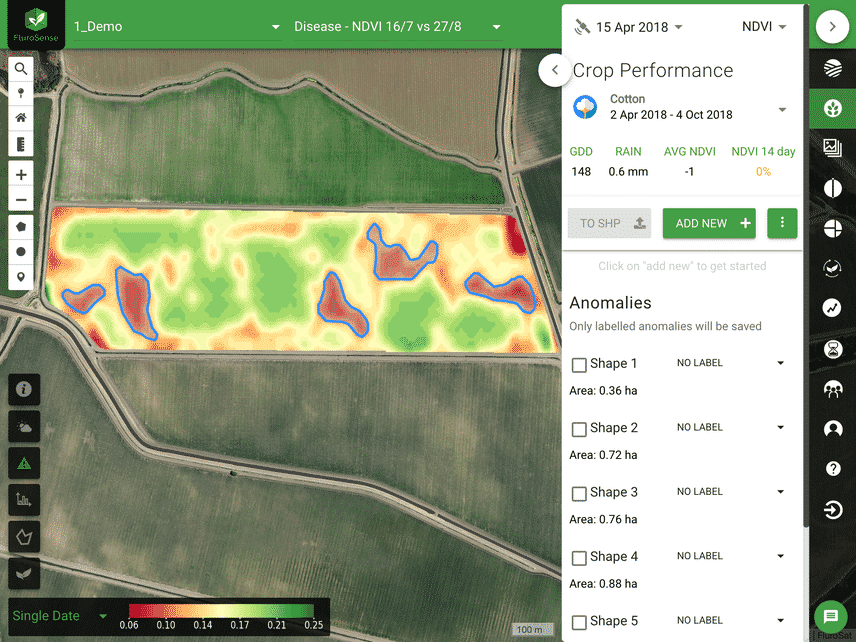
Areas of the field with vegetation index values significantly lower than the field average, or lower than previous dates, can indicate crop stress. The algorithm will identify these areas, and outline them in blue.
Each anomaly can be displayed or hidden on the map by clicking its checkbox. You can also label each anomaly from a drop-down list.
Saved anomalies can be viewed or edited by selecting them in the “Crop Activity” section of the “Crop” panel.
Finally, label each anomaly and select either crop damage or scouting. Labeling is crucial to maintain records of the anomaly's progress. For example, if you were conducting a trial, you may like to check the performance of the treatment over a season and refer back for later seasons.
Use TerrAvion high-resolution imagery
In the Crop Performance tab, select the Terravion data that you want to use. The anomalies will be automatically outlined in blue.
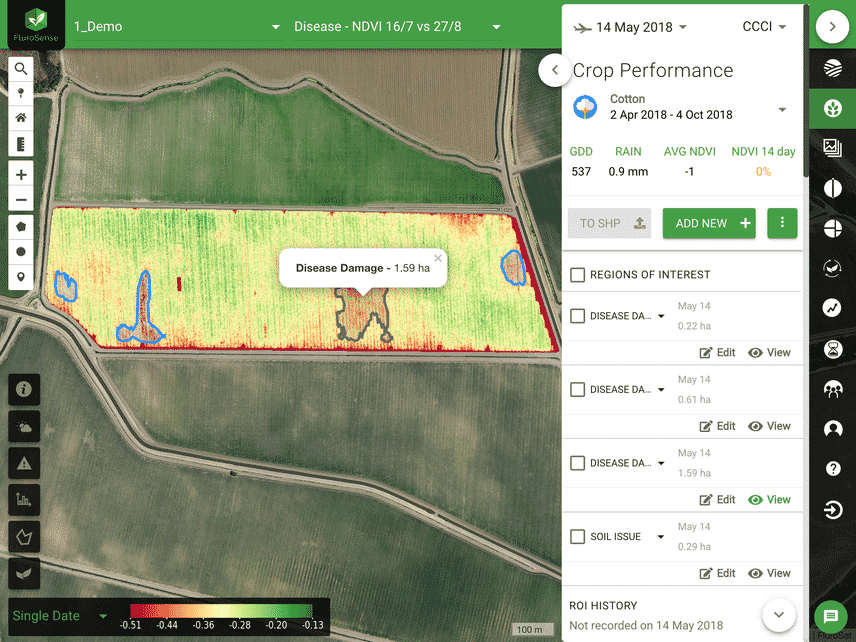
In the anomaly's history, it displays when was first and last detected, its size and also the risk to the crop (low-med-high). See this information more in detail on the map by clicking on the view button.
Manually track crop performance
Areas in your field with specific issues or characteristics i.e, N tests, different crop varieties, parts of the soil that has a lower elevation, etc...may need manual marking.
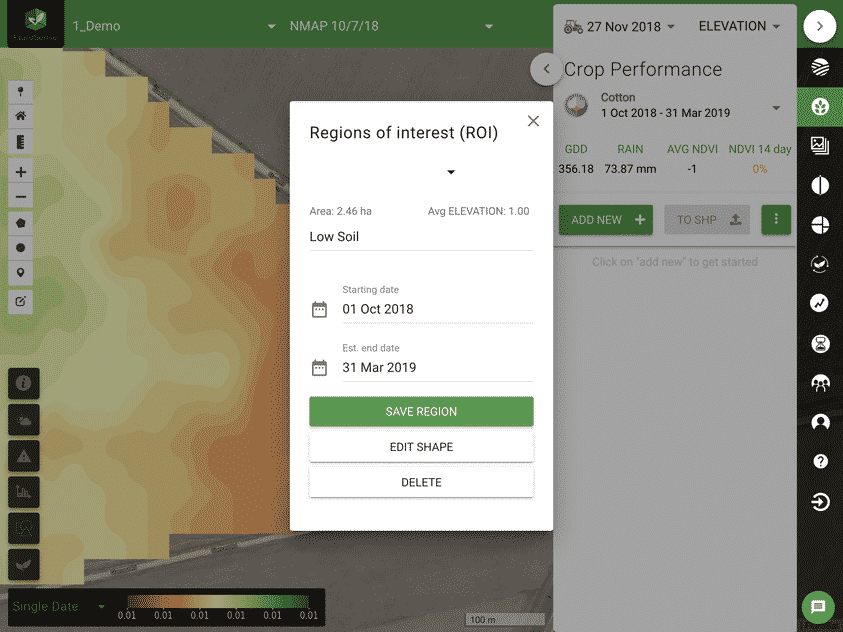
Click on the "draw a polygon” or “draw a circle" button on the left side on the screen and draw the boundaries of your area of interest. Don't forget to enter the details of your anomaly such as name, starting and estimated end date. Once you hit Save Region, FluroSense will populate the anomaly in the field.
The Anomaly tool is available on our paid subscription.
Book a demo with an agronomist or, contact us here to get an upgrade.