Contributors
Subscribe to our newsletter
See how regular remote sensing-based crop monitoring made it possible to quickly quantify the damage to almond blocks due to unexpected irrigation system outage.
With frequent droughts and strict water restrictions, optimising irrigation is on top of the list for farm managers in the almond, and fruit/nut industry overall.
FluroSat has been working closely with our partner Netafim to take irrigation monitoring to the next step by combining Netbeat automated irrigation system with FluroSense agronomic analytics.
What happened and what was the issue?
This case study demonstrates how the crop damage introduced by one-time water stress (due to a power outage) was detected affected almond blocks were quickly identified. Following the farm manager's observations, the southeastern quadrant of the almond orchard being severy affected.
How did FluroSense analytics help?
The farm split into 6 management blocks (see map below). FluroSense automatically retrieves satellite imagery and weather information and calculates a range of vegetation indices and plant health parameters.
Crop canopy chlorophyll index (CCCI) is one of these vegetation indices, which provides a measure of chlorophyll content in the tree leaves - an important indicator of tree health.
For each of the management blocks, FluroSense automatically generated crop canopy chlorophyll index (CCCI), as shown for 3 main blocks on the graph below.
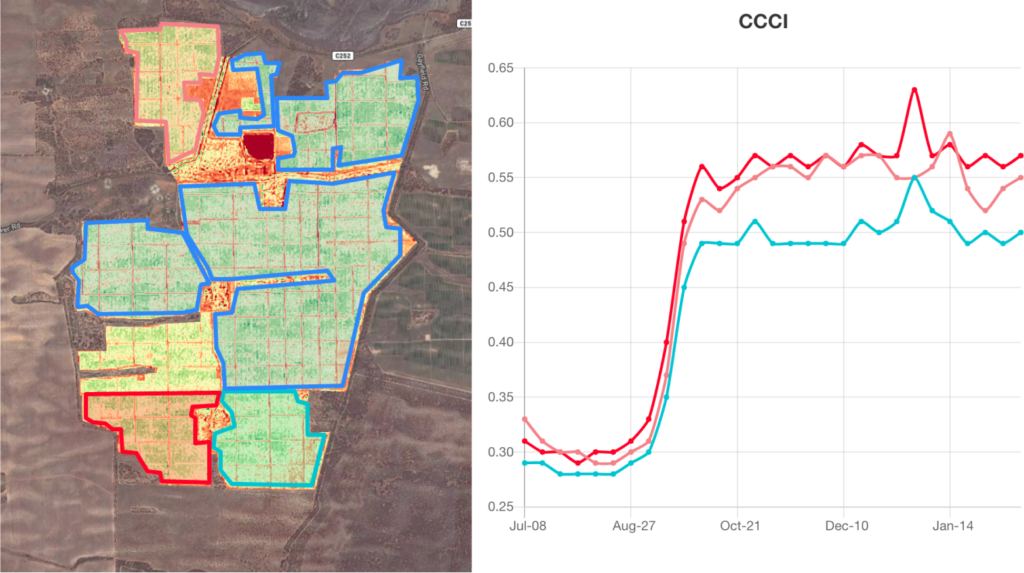
Almond orchard management blocks (left) and Chlorophyll index trend (right) show for the key three blocks. The colour of the outline of the area on the map (pink, red, blue) matches with graph line colour.
The CCCI values for each block are significantly different but change proportionally until January 4th. These differences are related to permanent variability in soil, variety or age of the trees.
Case study summary
The effect of the power outage that occurred on January 9 is clearly detected on CCCI and confirm that the southern part of the orchard suffered from water stress during this period.
The spectral signature also identified how the blocks recovered from this stress and show significant differences between blocks. The blue area is more affected over time than the others.