Contributors

Subscribe to our newsletter
Note: In 2021, FluroSat and soil health startup Dagan combined forces to become Regrow. Up-to-date information about the Regrow platform can be found on regrow.ag.
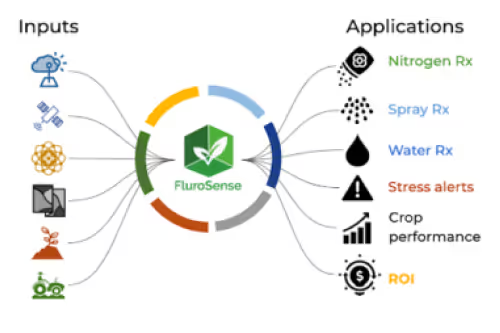
At FluroSat, we believe in providing our users with a variety of ways to analyse crops. Through FluroSense, users are able to utilise the different types of scales to visualise data, inform their decision-making processes and optimise their crop development.
In FluroSense, users have the option to select between two scales "Single Date" and "Whole Season", by simply clicking on the dropdown menu located on the bottom left side of the screen.
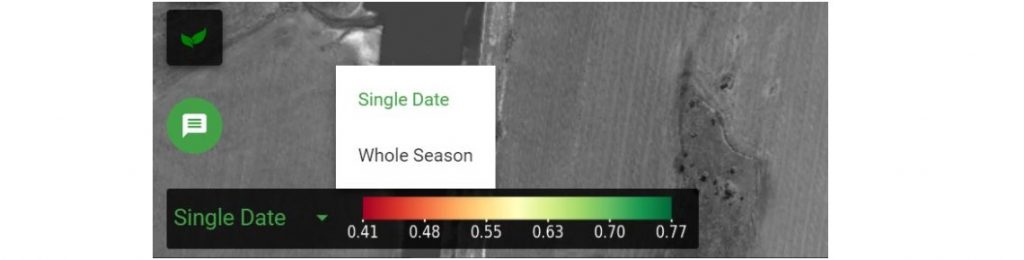
Single Date
The “Single Date” scale is the one that is shown by default in FluroSense. This scale automatically adjusts to fit the index range for a single day and stretches it over a red to the green colour scale. By adjusting the range of the colour map to fit only the present index range for any single image, this scale displays data with a wider spectrum of colour, resulting in an image that has much more detail. This allows users to easily identify which are the best and worst-performing areas of a field for a particular day.
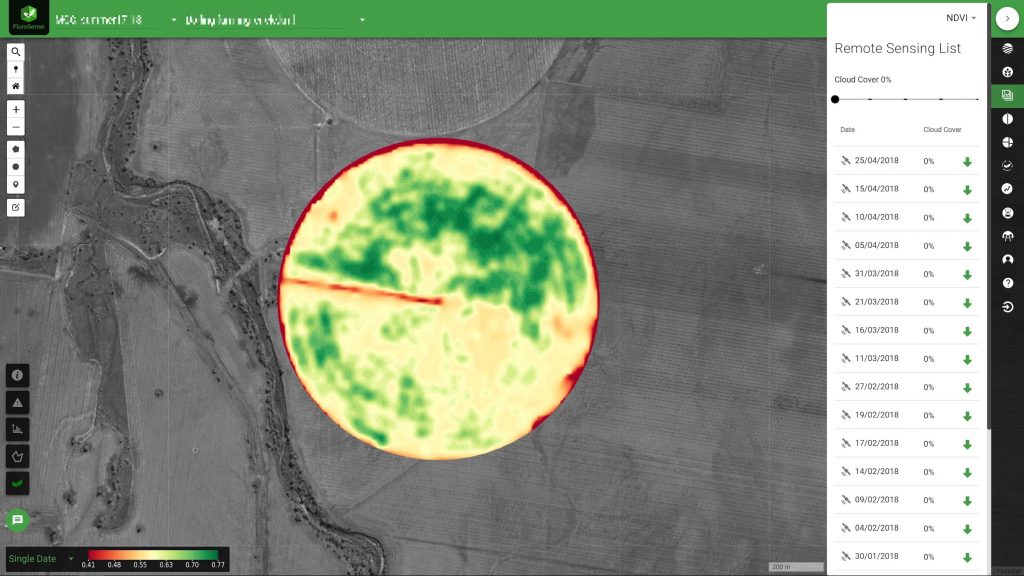

This feature can be used in conjunction with FluroSense’s “Zoning” feature to easily design particular zones of performance for a field which can then be used to optimise the application of plant and farm inputs, increasing efficiency and reducing costs.
In order to identify a crop’s current stage of development, users can compare the values displayed on the Single Date scale with the range of the index they are using.
Whole Season
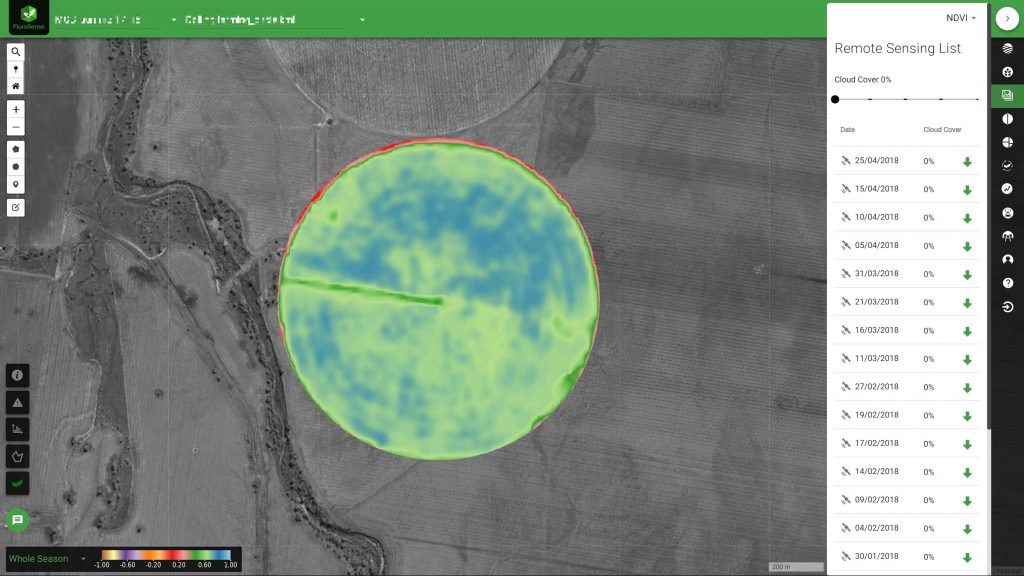
FluroSense also offers a “Whole Season” scale, which displays field data with a colour scale that remains fixed when looking at different fields or different image dates. This scale is great for showing the change in a crop over time when monitoring fields throughout the season. It makes it easier to identify the particular stage of development that a crop is in since the scale’s range stretches out over the entire range of possible indices (-1 to +1). For instance, the image below is the same as the image above, however, is now displayed using the “Whole Season” scale. This image clearly shows low NDVI values, indicating that the crop is not yet fully developed.
Indices Ranges
FluroSense provides a variety of indices which can be used in combination to monitor a crop over its full lifetime, from sowing to harvest. The timeline below provides an illustration of which index you would use at each particular stage of development.

MSAVI: range goes from 0 to +1. This index is mostly used to follow the first stages of the crop as it’s the most sensitive. However, it soon becomes saturated and less useful for measuring crop development.
NDVI: range goes from 0 to +1. This index is mostly used to follow the middle stages of the crop. It gets saturated when the crop’s canopy reaches high biomass values.
NDRE: range goes from 0 to +1. This index is mostly used to follow the crop when it’s fully developed. It rarely gets saturated. One major drawback is that this index is insensitive when the crop is starting to develop.