Contributors

Subscribe to our newsletter
Analysis of sample points
The analytics tool generates an analysis of specific points in your field. In this guide, we’ll show you how you can track the health of your crops, the impact of weather events like frost or give your actionable insights for instance when to harvest for optimal yield.
Time to read: 2 mins.
Map your crop trends
The analytics tool can track the crop’s performance over time. Once the sample points have been placed, the tool will generate a series of graphs comparing the season's dates to the vegetation values.

Start by clicking on a point in your field, and a graph of reflectance values for all the indices will be generated. If you have existing tissue sampling points, they will appear automatically.
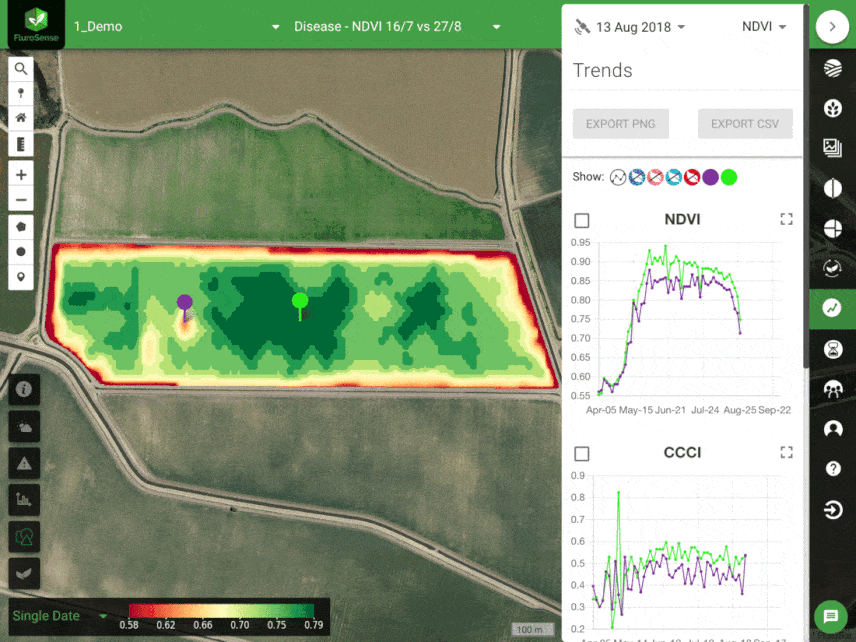
Want to download your graphs? Simply click on the Export button. The graphs are available in PNG and CSV formats.
Produce actionable insights by tracking crop performance
Here's an example of a wheat field in the May-November 2018 season.
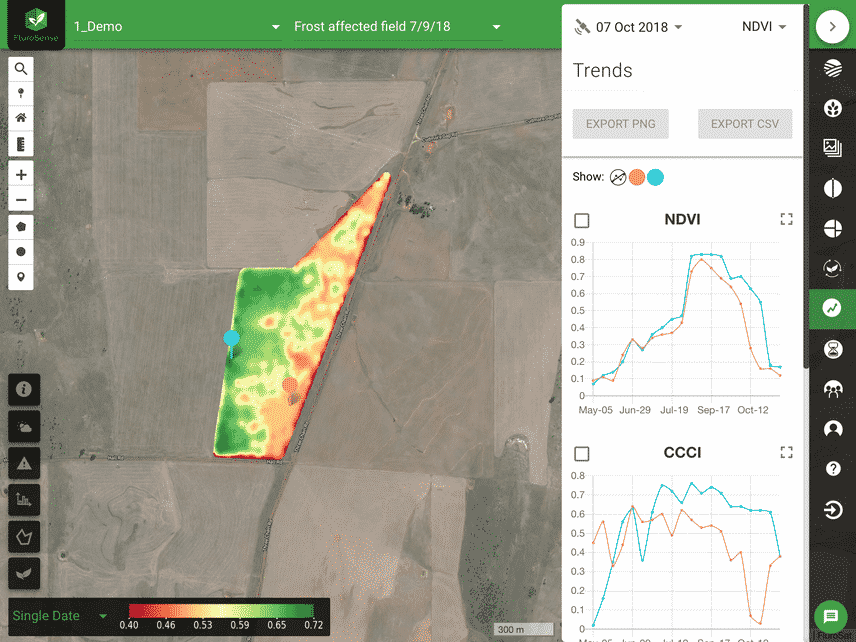
The vegetation indices helped the user to identify the parts of the field that were affected by frost damage. In this case, the frost occurred on the 7th of September. Using these graphs, the user compared the NDVI values with another part of the field that wasn’t affected by the frost. As a result, these insights could then be used to create actionable insights, such as when to harvest the wheat.