Contributors

Subscribe to our newsletter
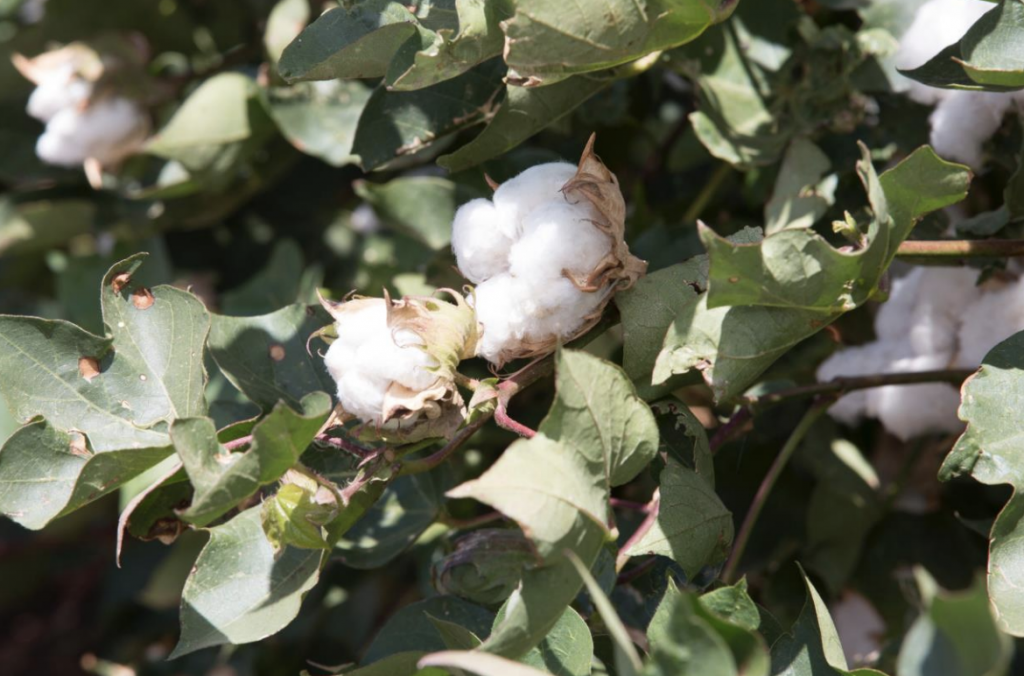
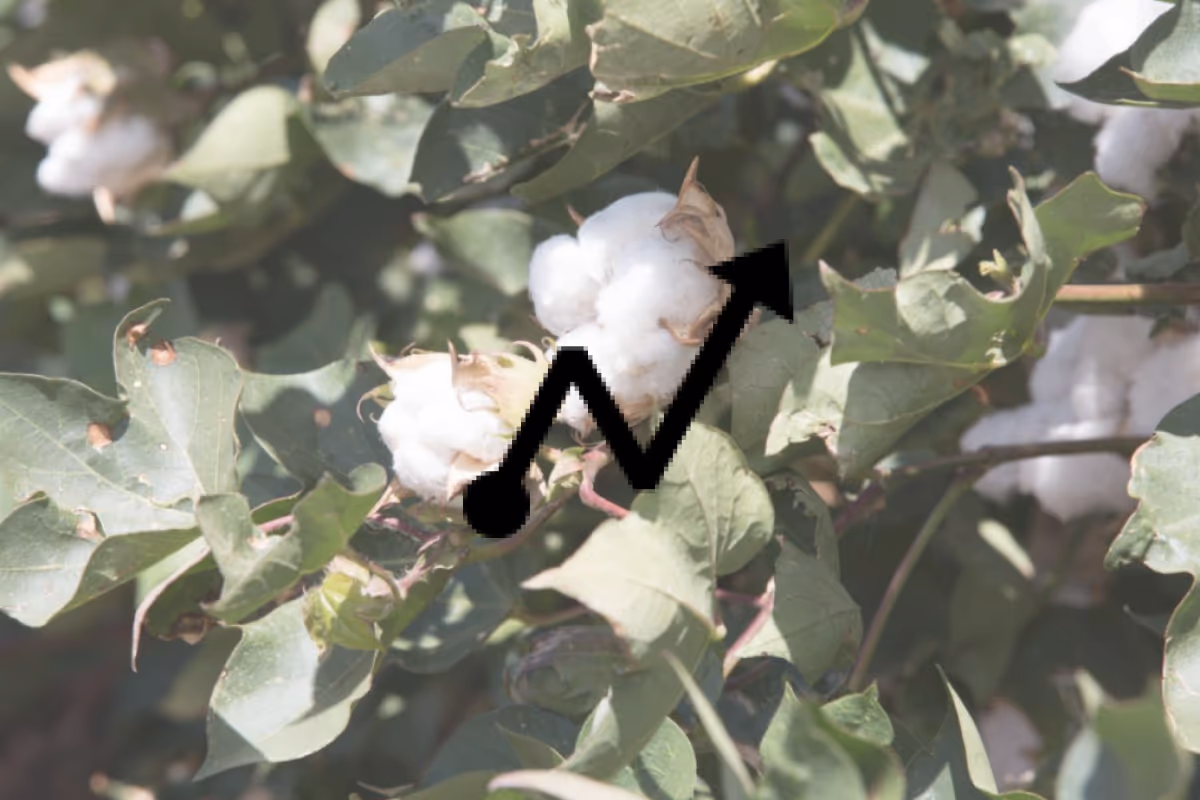
Gwydir Valley, centred in the town of Moree in NSW, is one of Australia's main cotton production regions. With over 150,000 hectares growing cotton and split evenly between irrigated and dryland, Gwydir Valley regularly delivers world-class yields of above 10 bales/ha from irrigated farms.
With climate change adding uncertainty to an already high-varied rainfall rate, Gwydir Valley's agronomists and growers are constantly looking for ways to maintain high yields while reducing water and nutrient costs. One of whom is Rob Holmes, a local agronomist who has long championed using science to inform his work and using FluroSense to inform the fertilisation strategies for his customers.
How does FluroSense work?
Using multi-spectral data acquired from satellites that pass over the Moree on an average of once every 3 days, FluroSense analyses the chlorophyll reflectance in relation to the crop biomass to quantify the nitrogen status using a range of advanced remote sensing techniques.
The core of this nitrogen quantification algorithm is its ability to filter out reflectances unrelated to crops so that it can accurately and reliably quantify the "fitness" of the plant matter present in the paddock. Nitrogen status maps are also further enhanced by water stress layers that can identify compromised yield because of water stress rather than nutrient deficiencies.
How is FluroSense used?
Prior to reviewing his nitrogen plans, Rob logs into FluroSense to look at a nitrogen map of all the paddocks he manages. Instead of having to physically scout each paddock to search for signs of crop stress, which can be like finding a needle in a haystack, Rob uses the maps to quickly pinpoint only those areas he needs to investigate from the comfort of his desk.
With up to 200km separating some of Rob's paddocks, this ability to use spatial data to direct his fieldwork means Rob can spend more time analysing and writing recommendations instead of being on the road.
"Using traditional scouting is a bit like 'pot luck'. I need to be able to see an area which might need to be sampled, only to realise the results are back. By this time, it's too late to do anything. With FluroSense, my fieldwork is way more directed. I'm sampling only those paddocks I either want to remove or set as the standard to baseline against. Eventually, FluroSense may remove the need to tissue sample altogether," commented Rob.
Due to the high frequency of data capture, Rob is also able to graph Nitrogen status over the entire growing for any point in his paddocks to identify trends and proactively plan in-crop variable rate applications. Field zones are created in and improve exported directly into Variable Rate maps for each season to the point where even direct use by field equipment. Scouting may no longer be necessary.
NDVI vs FluroSat's nitrogen status index
The analysis offered by FluroSense is substantially more enhanced than the commonly known NDVI index used to inform nutrient decisions. NDVI is limited by its close relation to biomass rather than nutrient content. With high-yielding crops like cotton, the NDVI index saturates early in the season, effectively "crowding out" the nutrient data vital for in-crop fertilisation analysis. The FluroSat nitrogen status index provides nitrogen monitoring and quantification that can be used to accurately measure an entire whole paddock, rather than the few points possible through tissue sample analysis.
Scientific studies performed by FluroSat have shown high correlation (R^2=0.68-0.75) between the nitrogen status index and laboratory tissue test results, whilst NDVI correlation with leaf nitrogen is often as low as R^2=0.2.
In the pipeline
A recent feature that is already proving to be a powerful tool is FluroSat’s yield projection graphs, using a combination of multi-spectral and historical yield data as a decision support tool informing Rob on where he will get the biggest return on nitrogen application.
While Rob is already impressed with the accuracy of FluroSat, he knows that by continually calibrating and enriching the nitrogen maps with yield and other external data, this accuracy will improve each season to the point where even scouting may no longer be necessary.