.avif)
Contributors
Subscribe to our newsletter
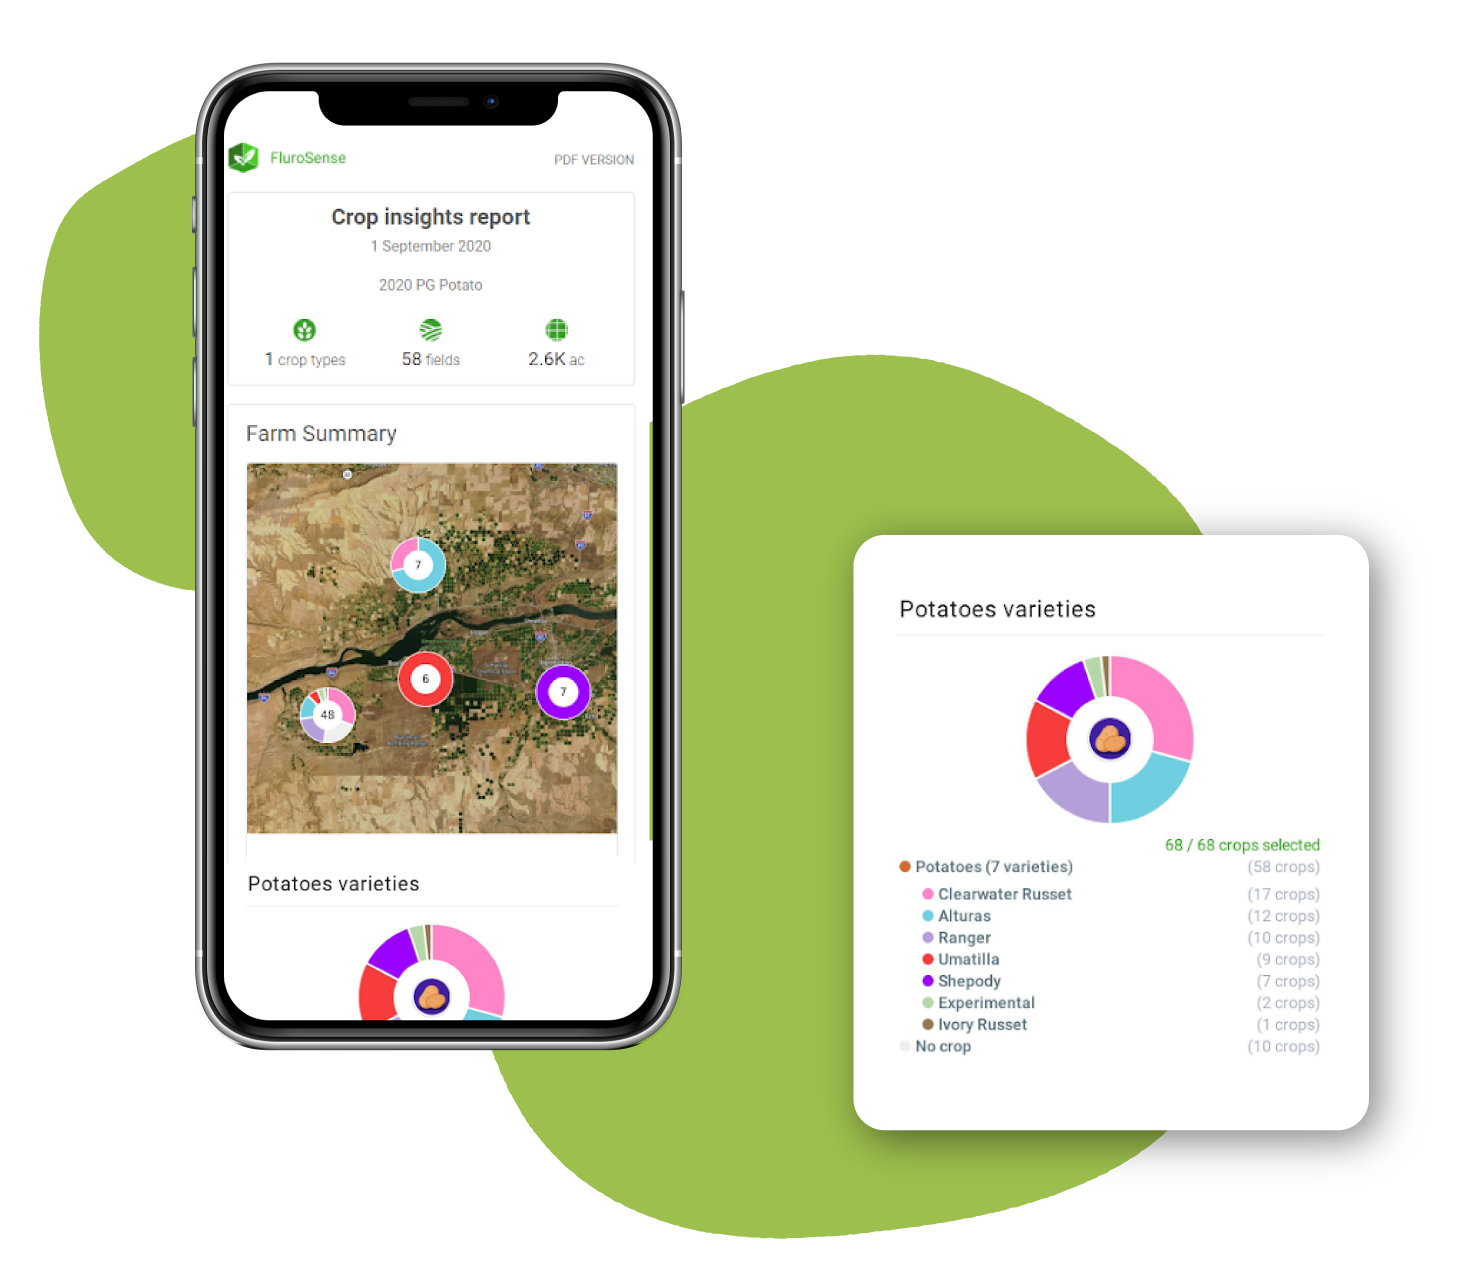
The Crop Insights Report
Improved! A report designed to proactively tell you what is happening in your fields at specific times, has been updated with:
- Custom logos for retailers and other businesses
- PR and RU languages
- Support multiple farms
- Toggle on and off some aspects of crop insights
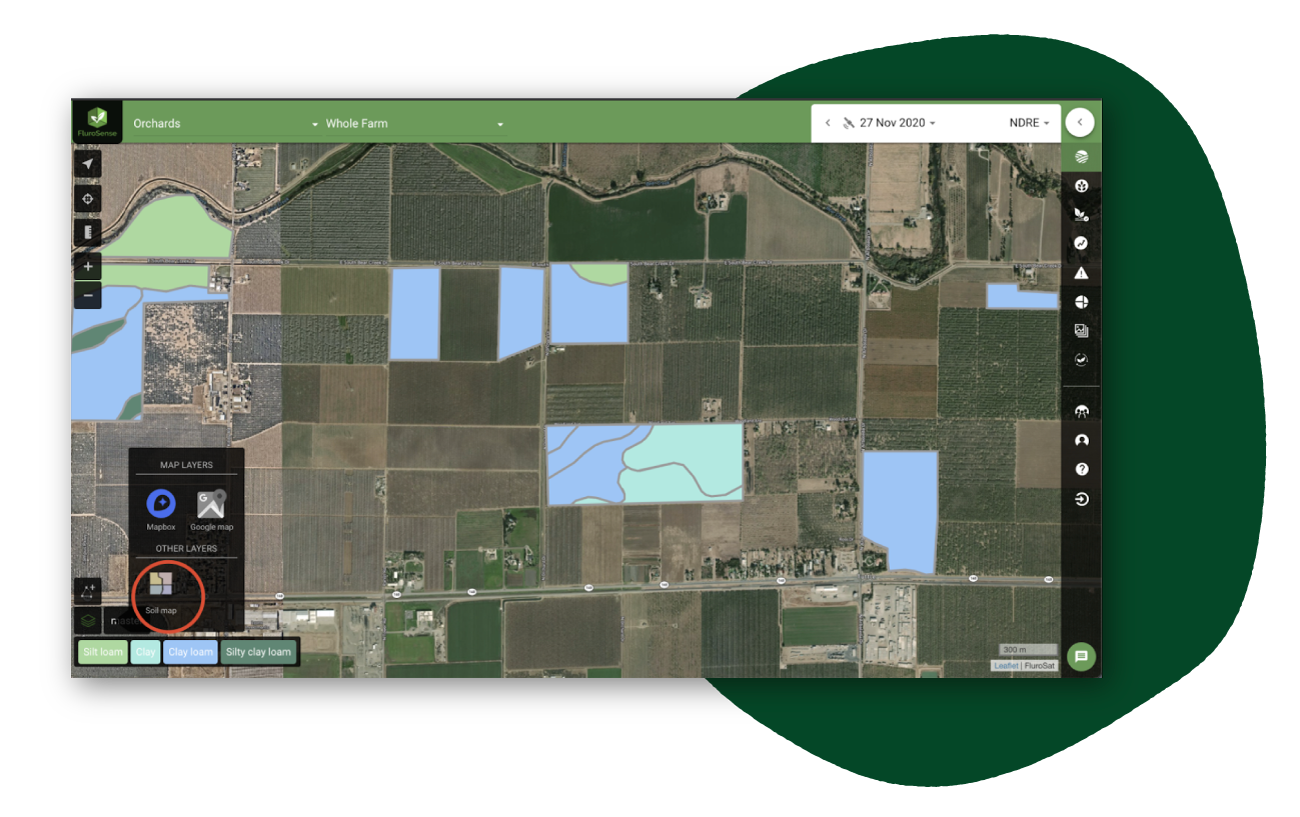
Soil Maps
Through ssurgo, a database of information about soil as collected by the National Cooperative Soil
Survey for over a century, this feature allows you to click on the map layers button on the bottom left
and select soil map. These maps are linked to a database of information about component soil and their
properties for each map unit, providing you a robust view of your fields.
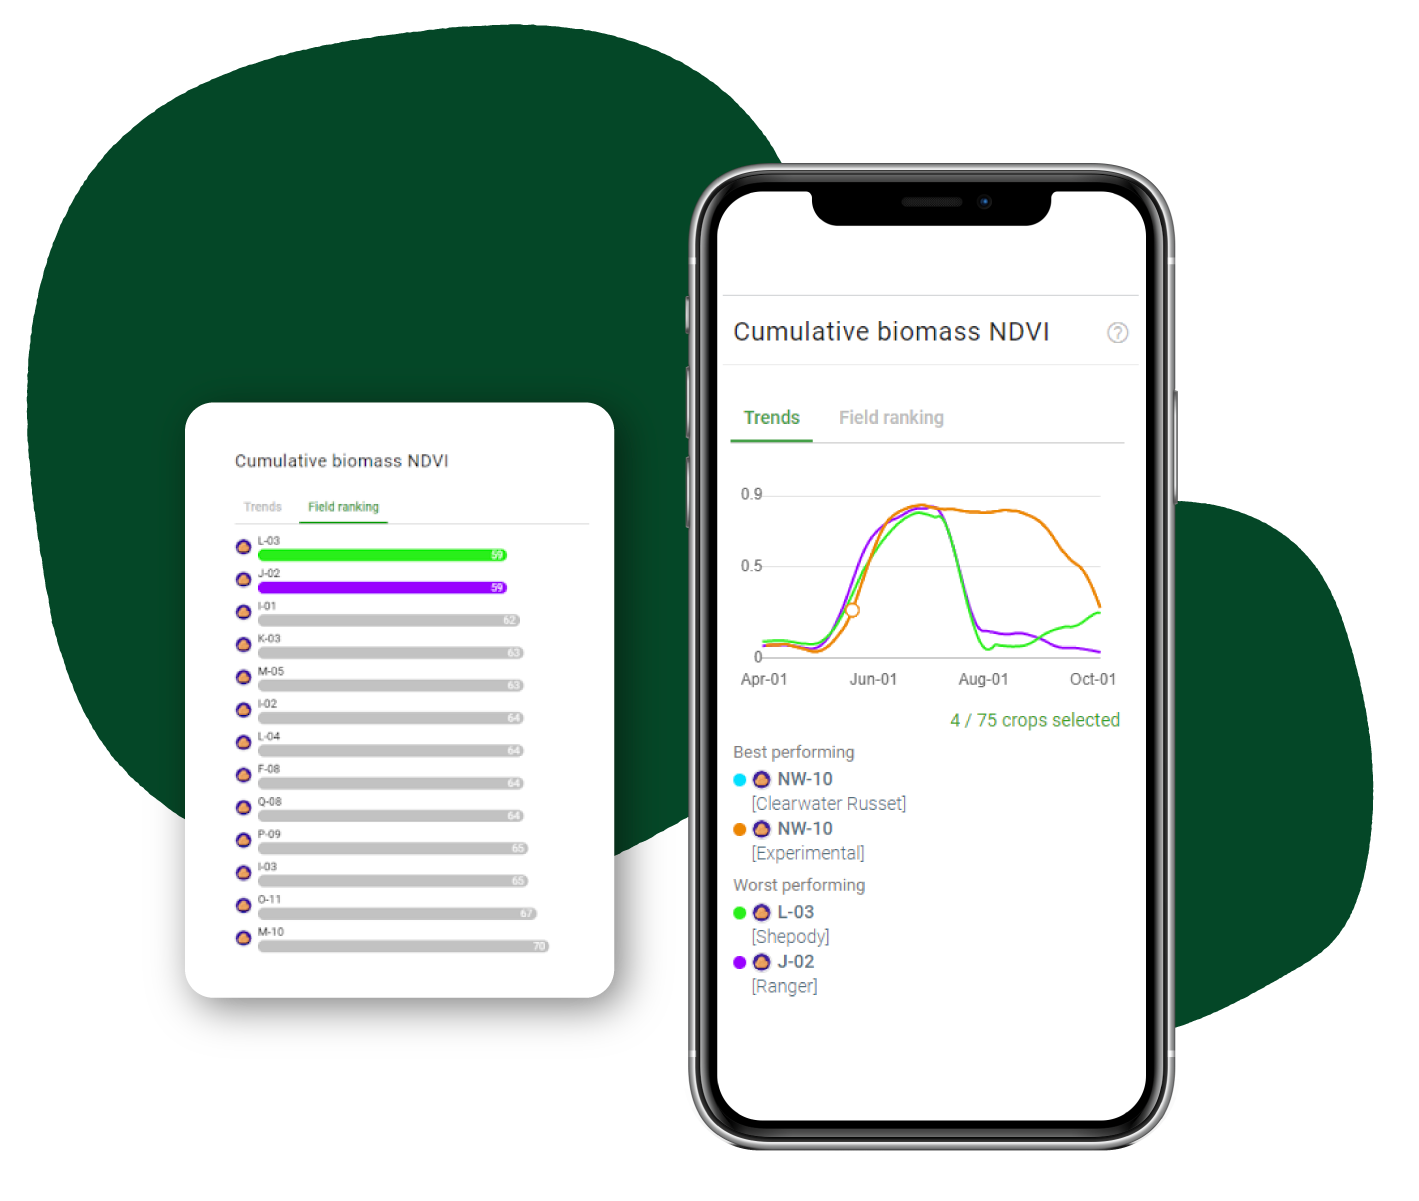
Cumulative NDVI
Bar charts are deployed for production. These are implemented on the same section as the average NDVI chart so you can switch between to better visualize and analyze the data. The logic of selecting or unselecting fields from the charts/maps remains the same as this deployment.
OPTIS Prototype
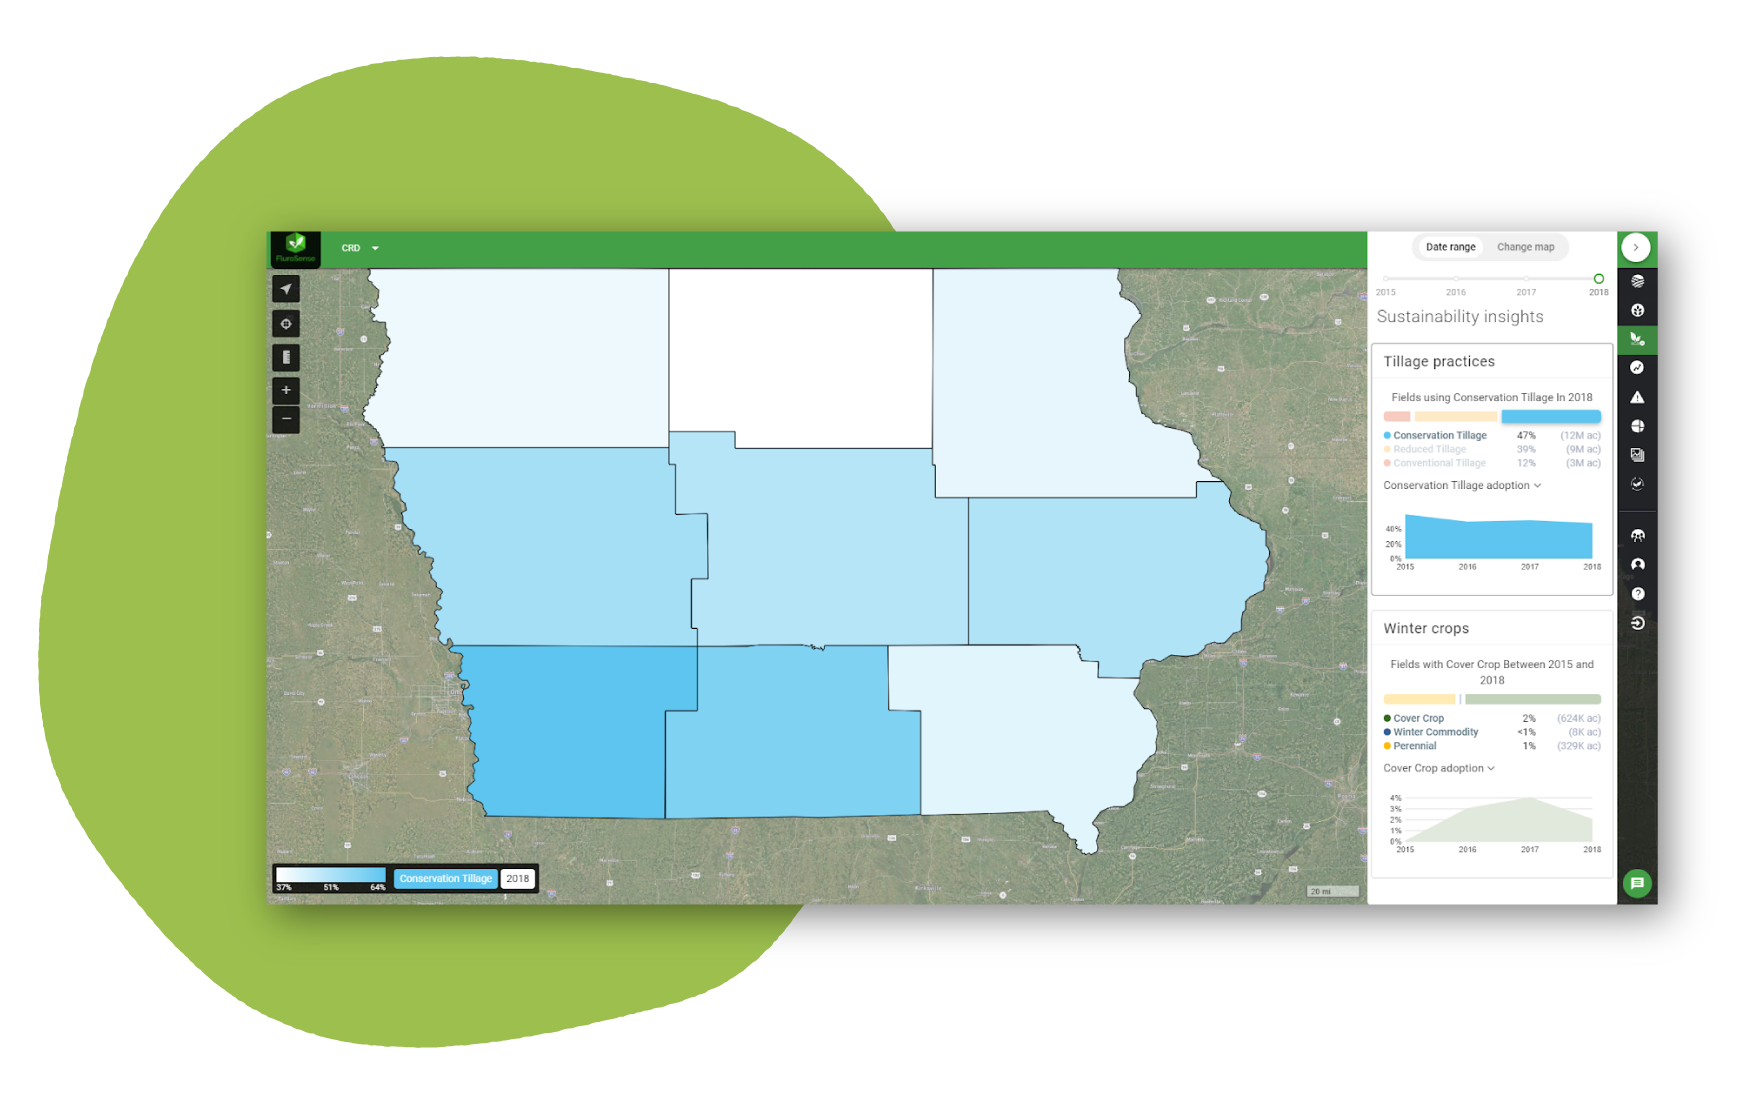
The OPTIS prototype, focused on conservation management and analysis along with overall sustainability practices and DNDC modelling SOC and GHG, has been updated with the following:
- % of each tillage category and cover crops
- Ability to select one or multiple CRD’s or counties
- data available between 2015 and 2018 so capable of selecting individual year
- for the state of Iowa currently