Contributors

Subscribe to our newsletter
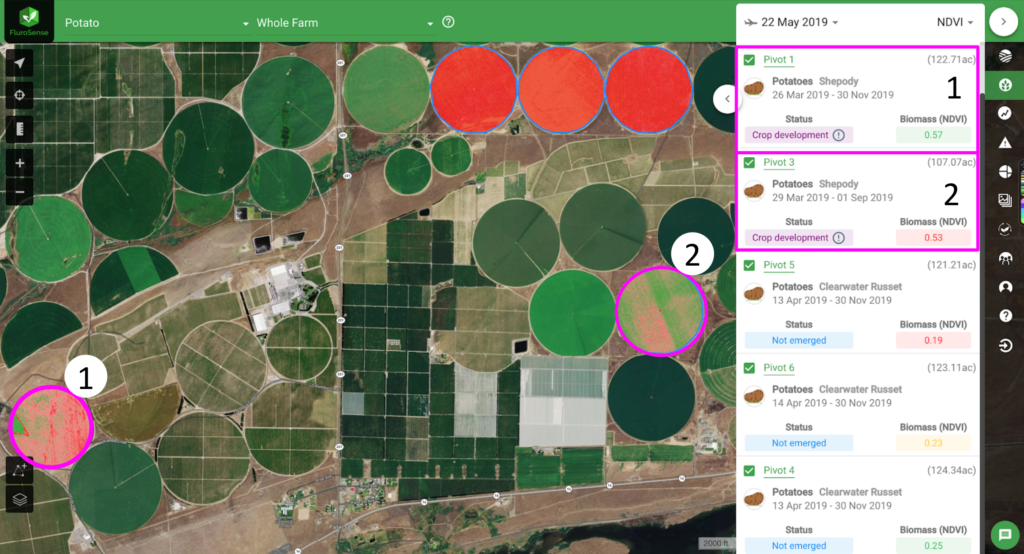
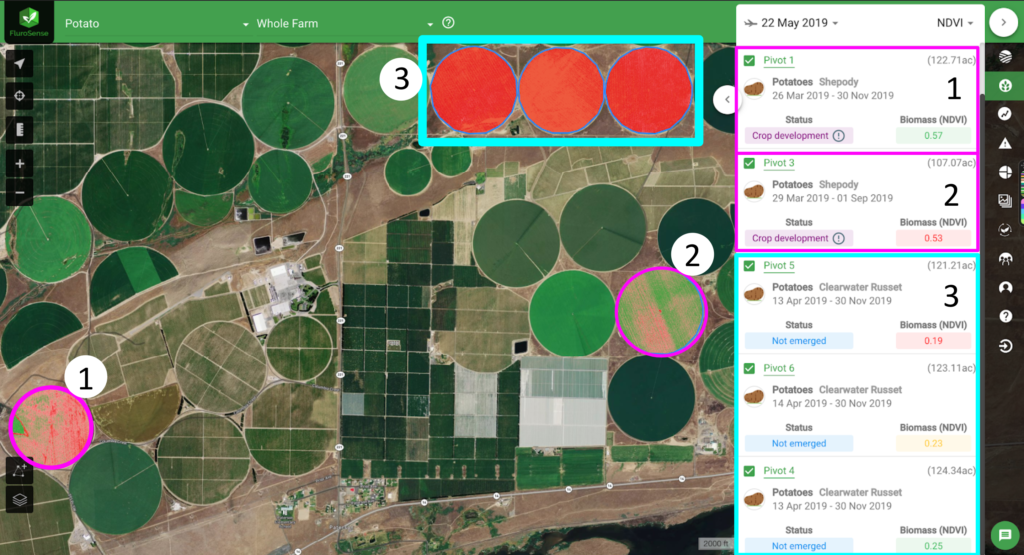
Since the 2020 crop has just been planted, let's take 2019 crop data on a potato farm as an example. With dozens if not hundreds of pivots, it is not possible to walk them all in a short space of time to know exactly at what crop growth stage is the crop in each of the pivots. This farm uses satellite and aerial imagery, and FluroSense platform, which you will see the screenshots of below, to monitor their crops and get the "crop status" metrics delivered to them using imagery.
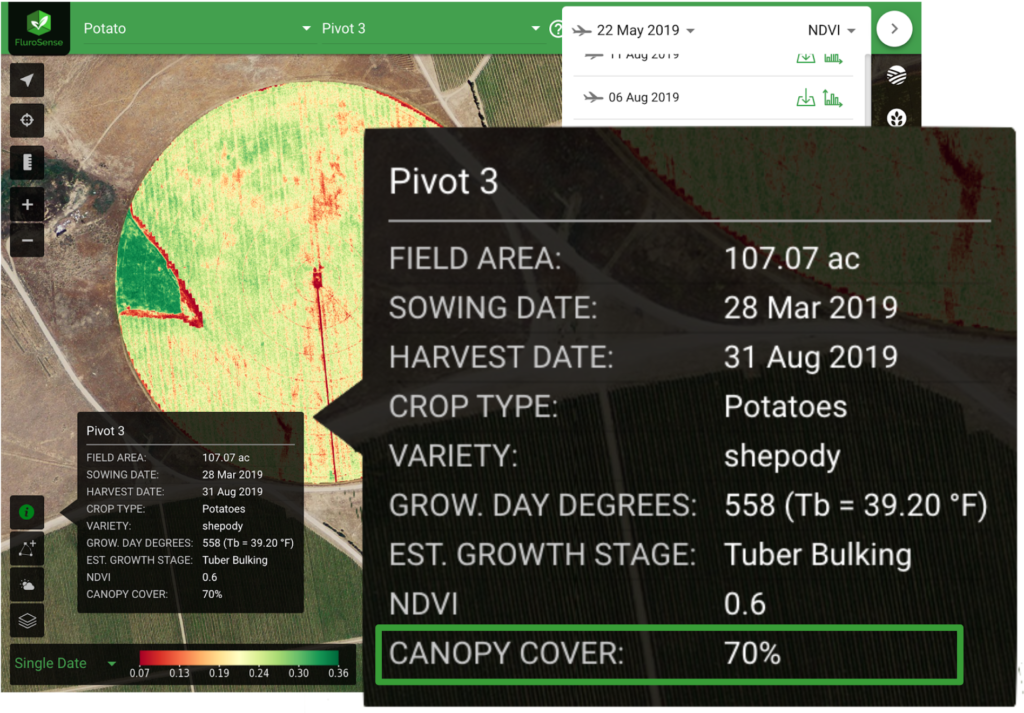
Field-level Crop Cover and Growth Stage estimation
For each individual pivot, using the remote sensing information (NDVI, it's variability across the field, and its trend of development) the platform automatically determine the crop cover %, and with the addition of the weather data (using agronomic models), it estimates the crop growth stage.
Farm-level crop development assessment
When you look at each individual pivot, you can only make field-specific decisions, whilst for making operational decisions, such as post-emergence herbicide or fertiliser application requires information about crop cover % (CC%) and crop growth stages across all fields on the farm.
Knowing where each of the fields with a particular crop type or variety is in its development, and being able to compare the field's performance with the average for that crop type/variety allows you to make optimal decisions around the timing of operations and select the order of fields for those operations to be carried out timing it with the crop condition optimal for the application.
https://youtu.be/FyLIEOXGG3I
Watch a quick 2 min video for an explanation of the use case presented in this article
To aid this farm-level analysis, Crop performance (CC% + growth stages) across the farm can be viewed using a map + dashboard, which allows to sort, filter and benchmark the fields within each crop type/variety.
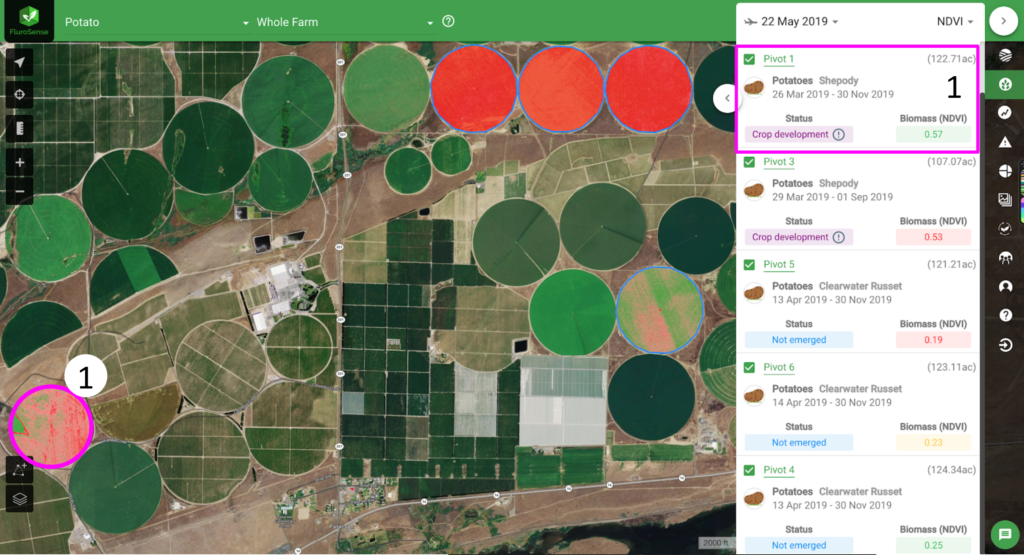
With this analysis of where each pivot and each crop type/variety is at, available to the operation managers and crop advisors at a glance, many operational decisions can be made! This also gives us information about the planting decisions, and how they can be improved for the next year (selecting an optimal location for planting of a crop type/variety based on its performance and yield in the previous year).
This analysis is handy to do from your tablet or in the office, but what about the time that goes into viewing these status updates regularly? This is something that is addressed with weekly Crop Performance email reports sent to growers, advisors and operations managers updating them on the status of their crop in time for the weekly team meeting!
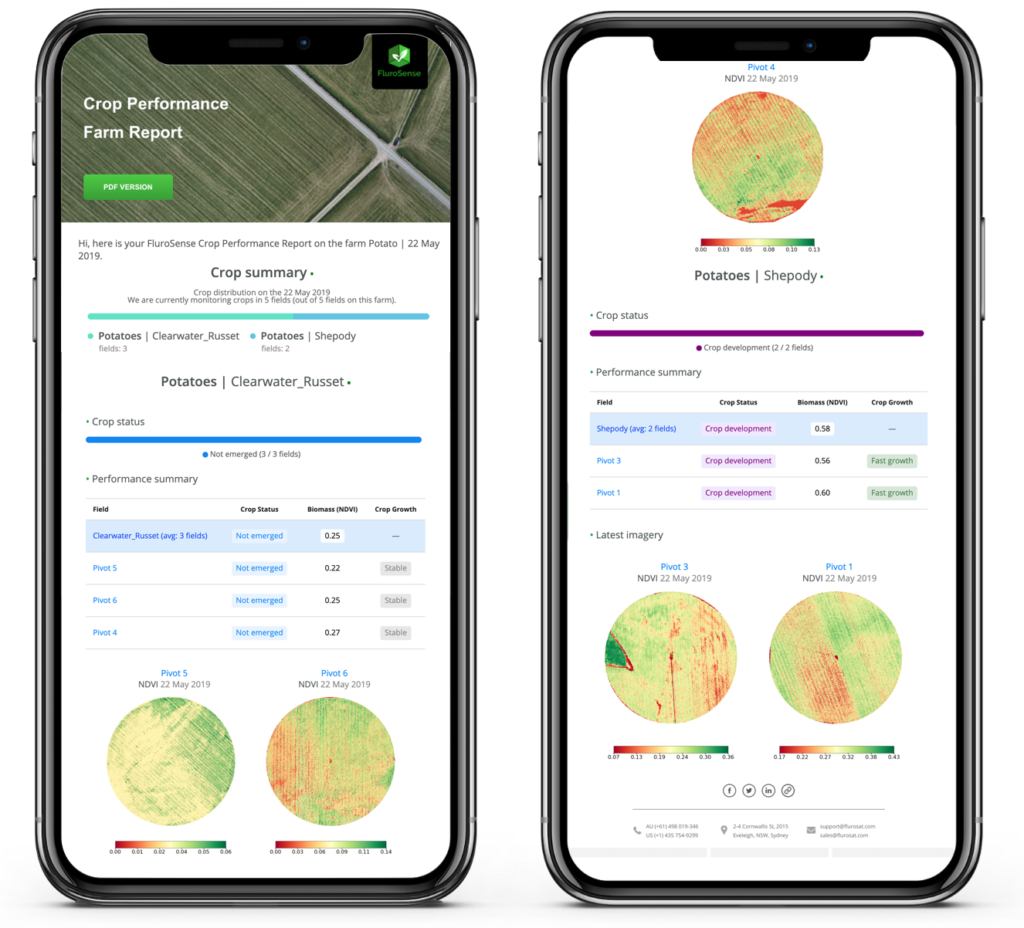
Need to know when the crops reach a certain growth stage to optimise the timing of operations on your farm? Let us know if you would like to have a Crop Performance set up for your farm. All you would need is just to have your field boundaries (in .kml or .shp file format) and a record of what crops your planted in each of the fields!