Contributors
Subscribe to our newsletter
The basics step of making a nitrogen recommendation are
- Defining areas in the field of ‘high’ and ‘low potential’
- Deciding whether you want to a) promote growth or b) boost yields.
You may also want to do both at different crop growth stages.
This article will cover in detail both the methods to use data to select the high/low potential zones, as well as the logic that can be applied to deciding where the nutrition is needed the most. Let's first look at the ways to determine the location of the high/low performing areas in your fields.
Pre- and post-season data sources
Macro and micro-nutrients in the soil set the baseline of nitrogen available to the plant. Soil sampling and soil mapping are the most popular methods used before crop season start to determine whether the field has any soil issues and whether it has enough nutrients in store for a good crop.
Soil mapping
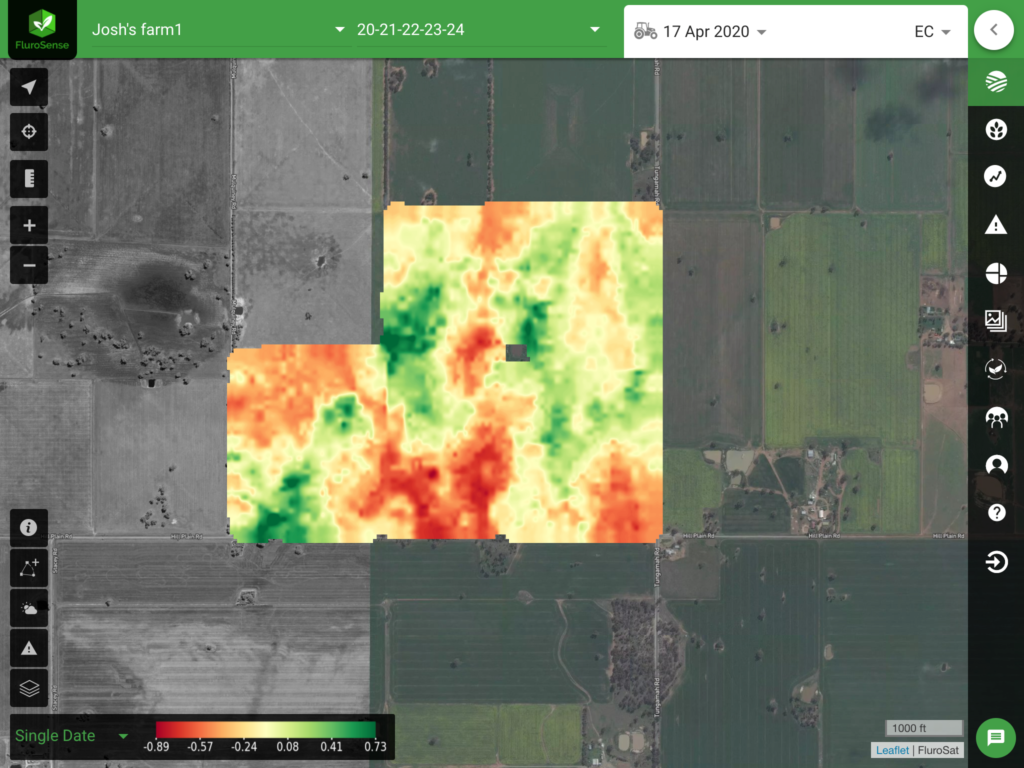
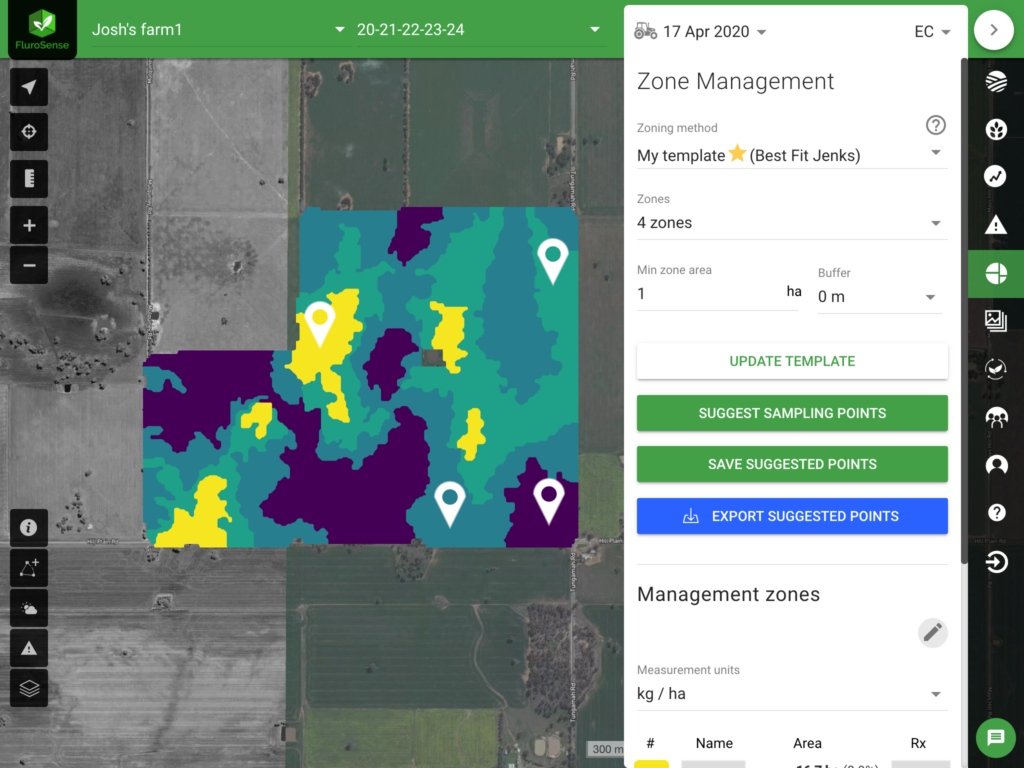
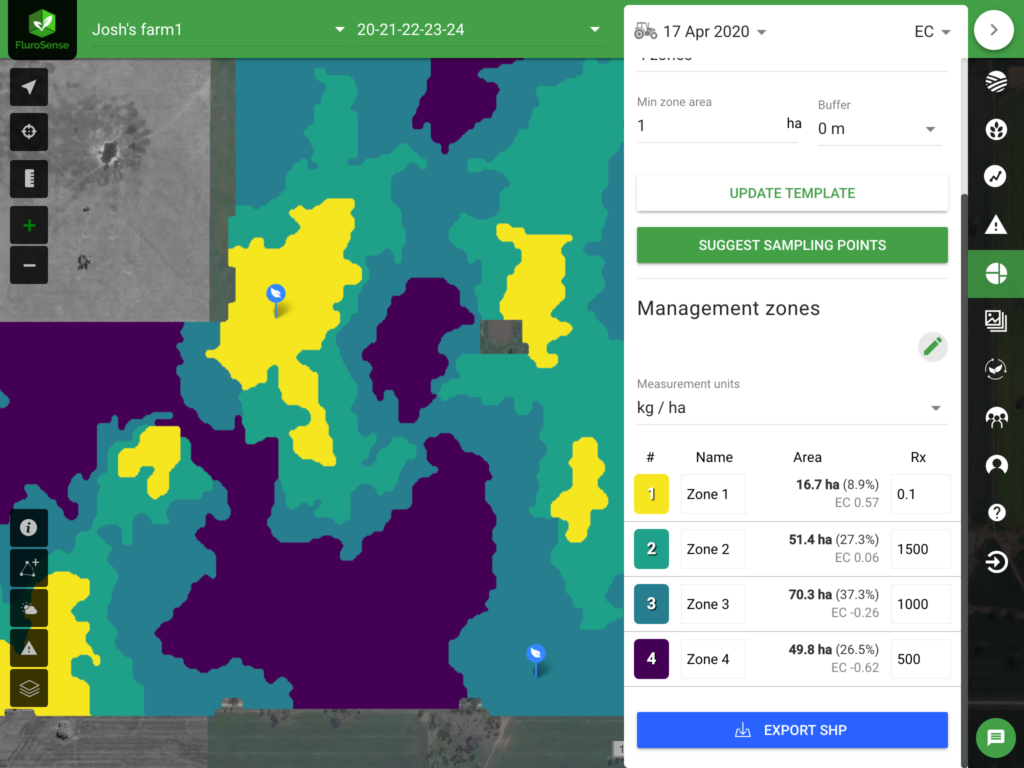
Soil variability across the paddock is not uncommon. A large variation in the soil types, and particularly in their pH levels, can be mapped using electrical conductivity (EC) soil mapper and trigger subsequent variable rate lime application. Soil (EC) maps give a general idea of how healthy or productive the soil is, and how the soil limitations can affect nutrient availability, through its salinity and subsequent effects on microorganism activity or moisture retention to support vigorous crop growth and yields.
Soil EC mapping alone, however, does not give you all the information that you need for the nitrogen application. It certainly shows the spatial variability in crop nutrient needs but in addition to it, you need to take soil samples to determine the nutrient levels in each of those zones. And the best way to do it is by creating management zones and sampling each of the zones (as shown in images below).
For more details on the use of EC mapping, read the case study here.
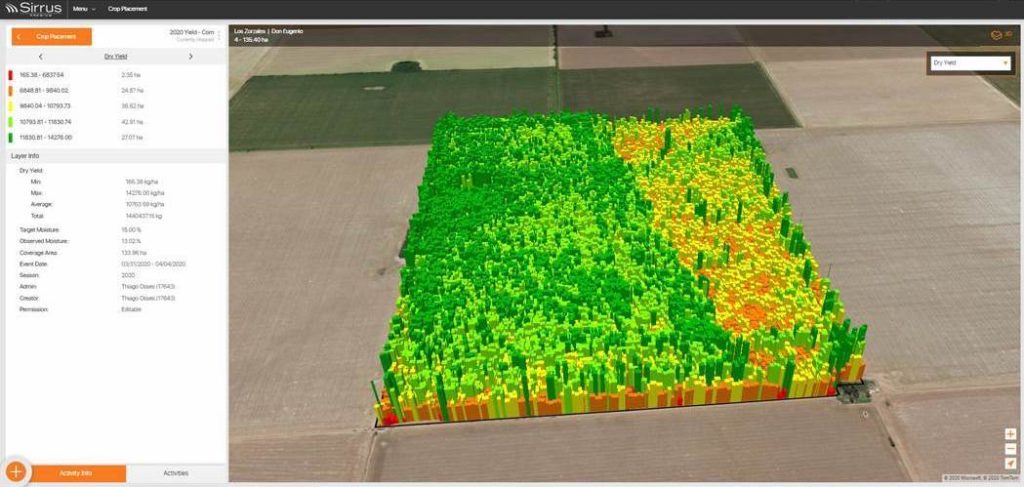
Yield map and its remote sensing proxies
Another data source that can help you understand the spatial variability of the field is, of course, yield maps. Yield maps are available from most modern harvesters and can bring a wealth of information, not only about the total yield from each acre but also about the quality of the moisture content of the harvested crop. However, the yield monitors are often poorly calibrated and harvesting often done in a pressing time of the season may leave no time to fiddle with instrumentation. Even in this case, not all is lost!
Remote sensing imagery can often provide a substitute for yield maps. Each crop type has its own "golden" time when the remote sensing best reflects the yield. For example, for winter wheat it's around early tillering and for corn it's in late vegetative growth stages/early reproductive stages.
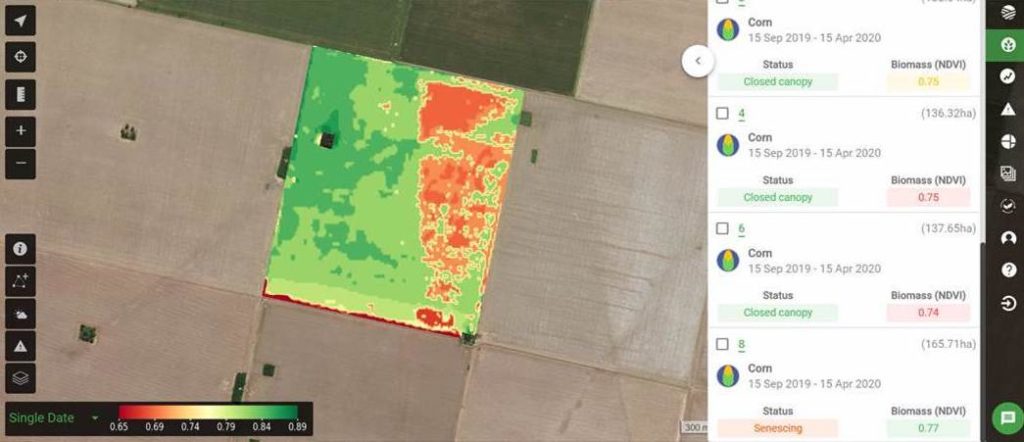
In-season data sources
As you can see from the example above, not all data relevant for nitrogen decision making comes post-harvest, remote sensing is a powerful source o information about the crop, which is available to you at any time in season!
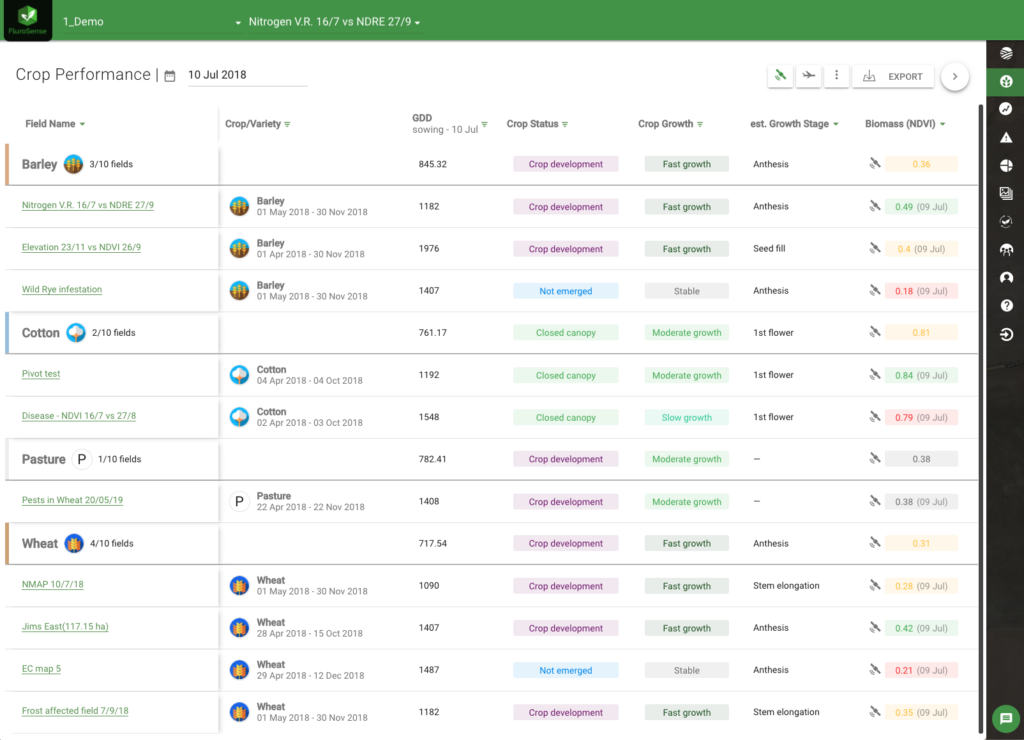
Estimating crop growth stages in season
It is important not only to know where to apply nitrogen but also to be applying it at the right time or specific growth stage e.g. right after emergence. For most agronomists, it is not physically possible to walk all of their growers' fields, and often they have to rely on a "general sense" of where the crop itself, rather than the hard data that whos growth stages in each. of the fields and for each of the crop types.
Often to determine the optimal application time, agronomist would refer to the weather data, and calculate the Growing Degree Days (GDDs) for their crop or inquire with the grower about the latest growth stages observed in the filed.
Modern remote sensing techniques, combined with agronomic modelling, such as in FluroSense platform, can bring objectivity, and clarity into this discussion, and help make an informed decision on the best time for nitrogen application.
Deciding which crops need more N
As demonstrated above, you can target nitrogen applications to specific growth stages in your crops. If your crops are at an earlier growth stage, you may want to help the "weaker" crops catch up to the more developed ones by adding more nitrogen to the areas with lower vigour, and not adding/adding less N to areas with higher vigour.
Later in the season, yield maximisation is key, and you will need to reverse the logic, and add more N to the areas with higher vigour, which are also more likely to respond to additional nitrogen availability and given the biggest increase in the yield or quality. At this later stage of the crop growth, applying nitrogen to the areas with ‘low potential’ is likely to result in minimal improvement and may be a waste of resources (cost of fertiliser, labour, and fuel to execute on the application).