Contributors

Subscribe to our newsletter
The compare tool allows you to review the performance of a crop over a period of time. This step by step guide will help you detect changes in crop behavior as both a "before and after" view or analysis of a specific date in a season.
Time to read: 2mins
Use the compare tool to map your field before & after treatment
Here's how to use the tool to measure the effect of a treatment on a crop in as a “before and after” analysis. Start by opening the compare tab and select your two dates and one vegetation index.
As an example, we're going to use the tool to compare two dates, 16th of July to the 27th of August, to one vegetation index which in this case is NDVI.
Cotton field in 1st flower stage showing signs of stress.
In this case, the grower found that parts of the field were showing a lower NDVI value compared with the field average. Using these insights, the grower applied a site-specific treatment plan. By comparing the dates to the vegetation index, the tool shows us that the disease treatment applied was effective because the NDVI value increased.
Identify crop behavior on a specific date
The compare tool can also be used with two vegetation indices on one specific date in a season to identify areas of potential crop stress, damage or objects which are not visible to the naked eye.
Let’s say that the grower knows that there is a possible diseases infection in this paddock, and they’d like to know what the impact is on their crop health three months after sowing. In this case, we’ll need to use for the same date, two vegetation indices to find out more.
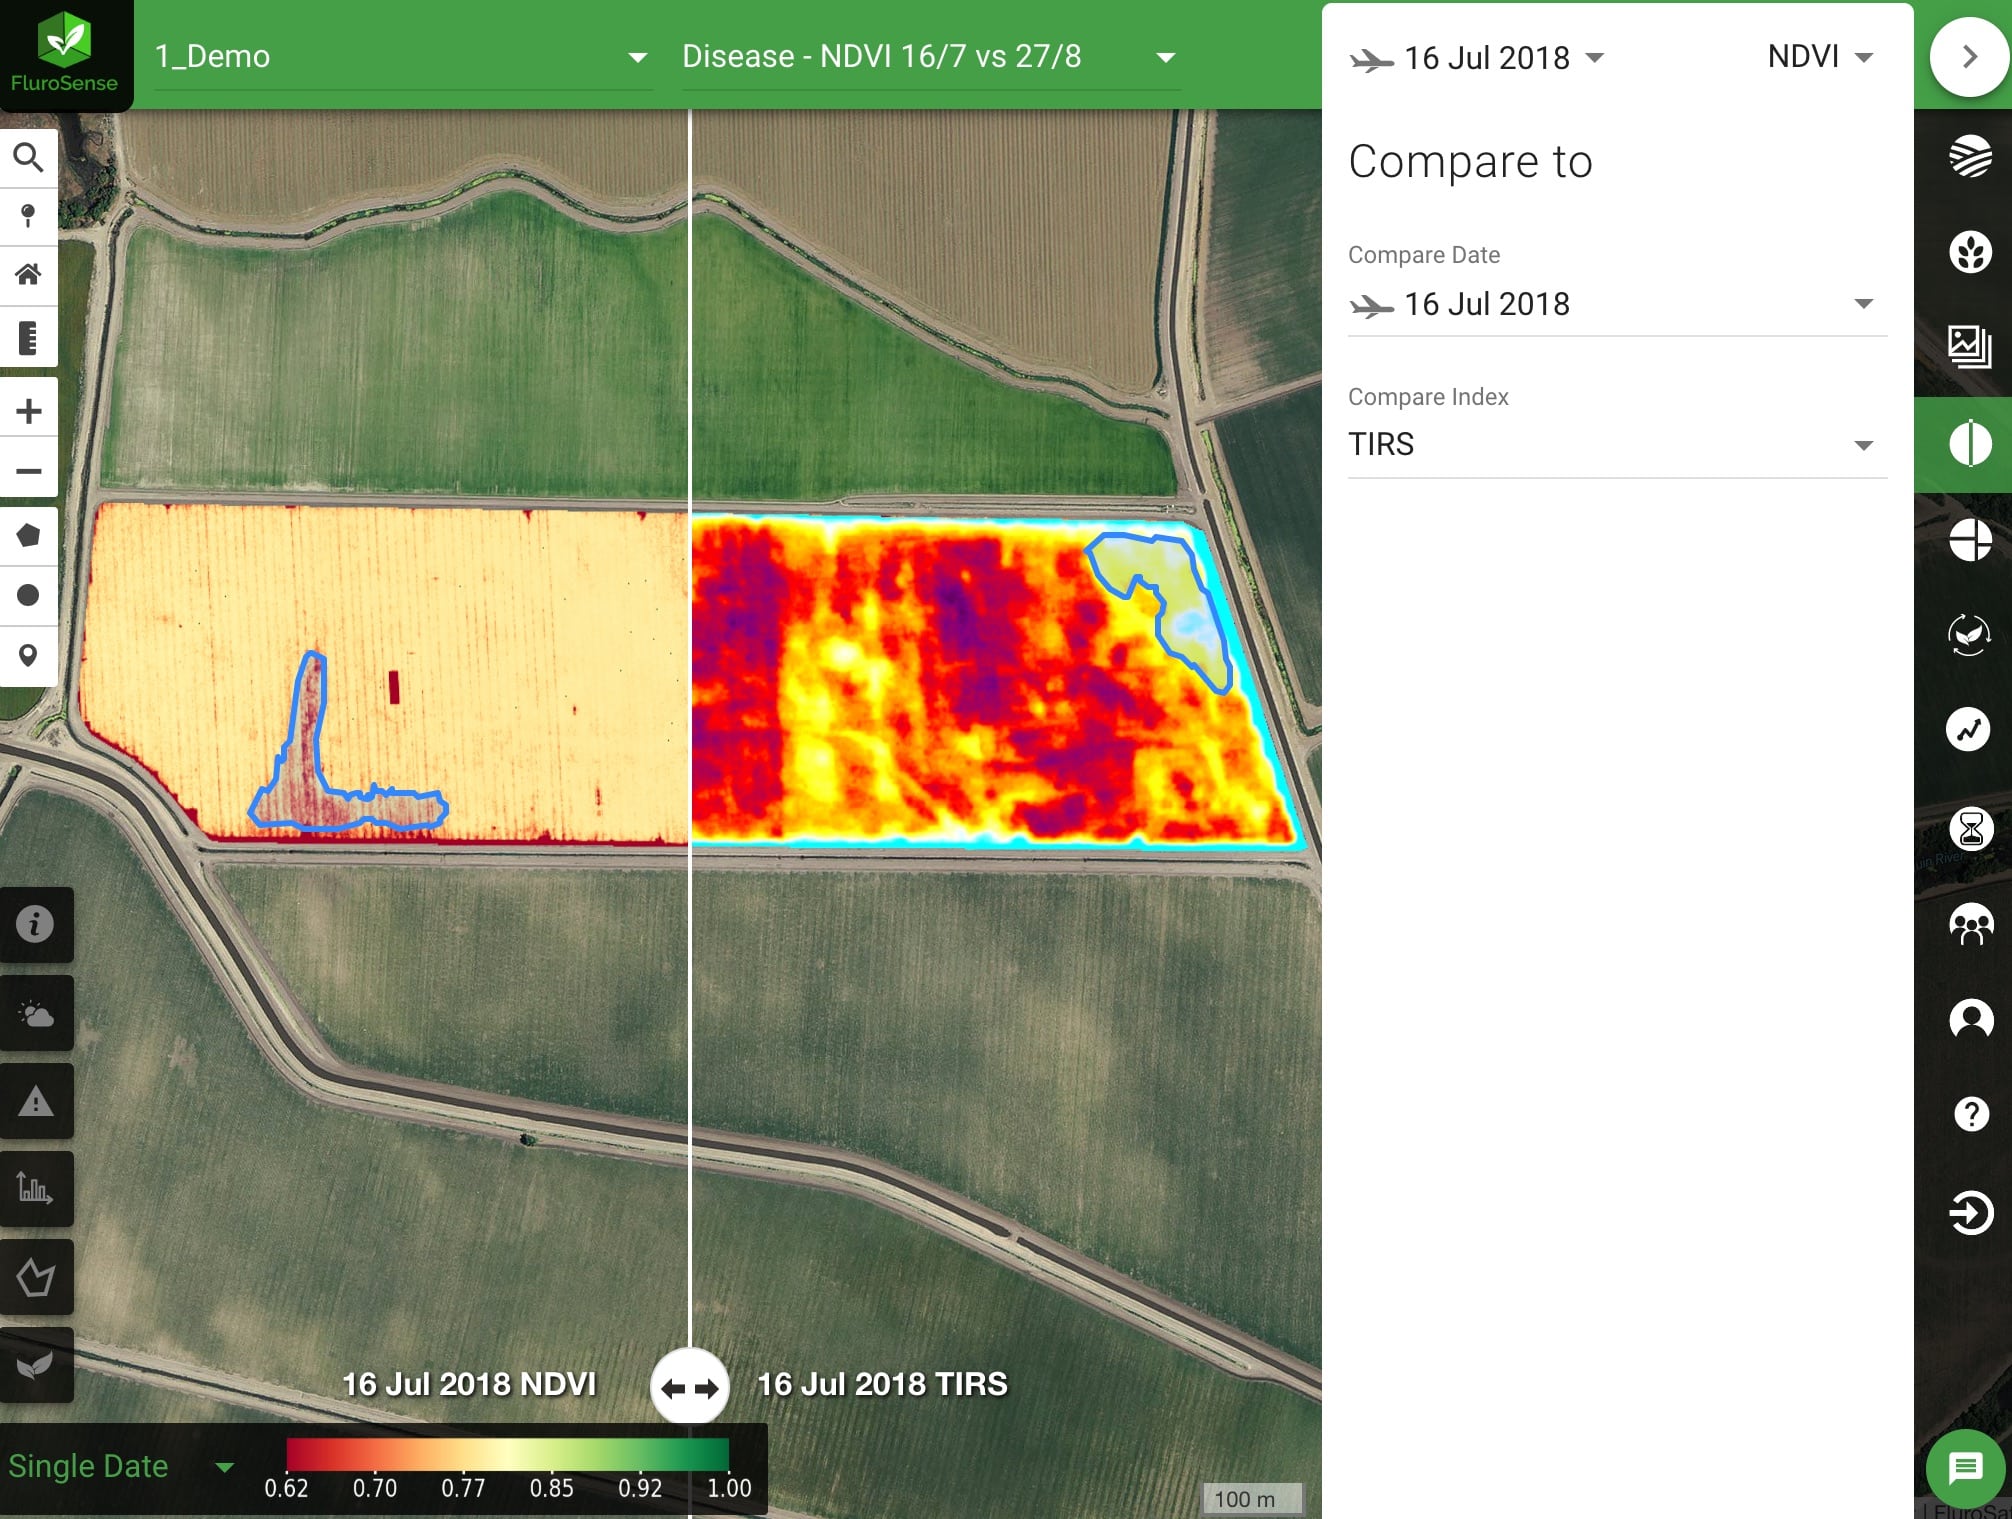
Comparing NDVI and TIRS on one date, we can identify which areas are underperforming. As this image shows, on the left side we can see the TIRS layer showing yellow areas (36 degrees) and on the right side the NDVI layer with red areas (0.66 NDVI). The grower can now make a management plan for these specific parts of the field that are showing the lowest performance due to the disease infestation.
Got a burning question?
Fill out this short form and our agronomists on staff would be delighted to help.