Contributors
Subscribe to our newsletter
Climatic uncertainties are causing headaches for agronomists and growers alike globally. It alters planting, harvesting time and ultimately could affect farm yields. In both the northern and southern hemispheres, an early and late frost respectively could be a possible factor to affect harvests and yields this year.
Across south-eastern Australia, the trend of increased temperature has come with a concern that frost occurrence may become more noticeable later into the season. Based on BOM's recent climate outlook report on 5 Sept, the potential impact of late-season frosts is fast becoming a reality and some regions have already experienced it first hand.
Whilst some crops are more resilient to frost than others, spatial and temporal effects of frost are usually not easily seen from the human eye. For example, when the freezing temperature is reached, it doesn't necessarily mean that crop cells are frozen or damaged, but stress the crop under these conditions.
Using remotely sensed multispectral imagery, we'll be able to start understanding the extent of frost impact by monitoring crop development and make the appropriate management decisions more readily.
Using weather metrics to understand crop exposure
To better understand crop's behaviour, it's important to have an objective measurement of the climatic influences that the crop has been exposed to. Having easy access to an automatic and daily-updated set of global weather metrics at the paddock level will benefit crop performance monitoring.
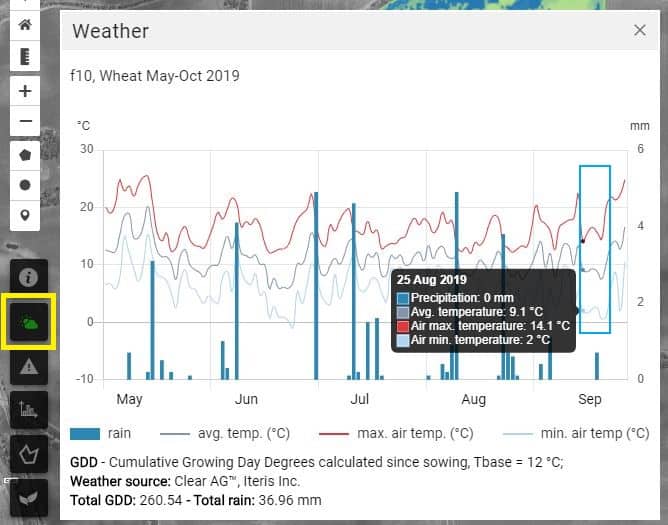
In the example below, through using FluroSense, we're able to see the prolonged minimum temperatures the paddock was exposed to. Taking note that the observed temperature of 2 degrees is an indication of a highly probable frost occurrence at crop canopy height.
Identifying frost impact using NDVI
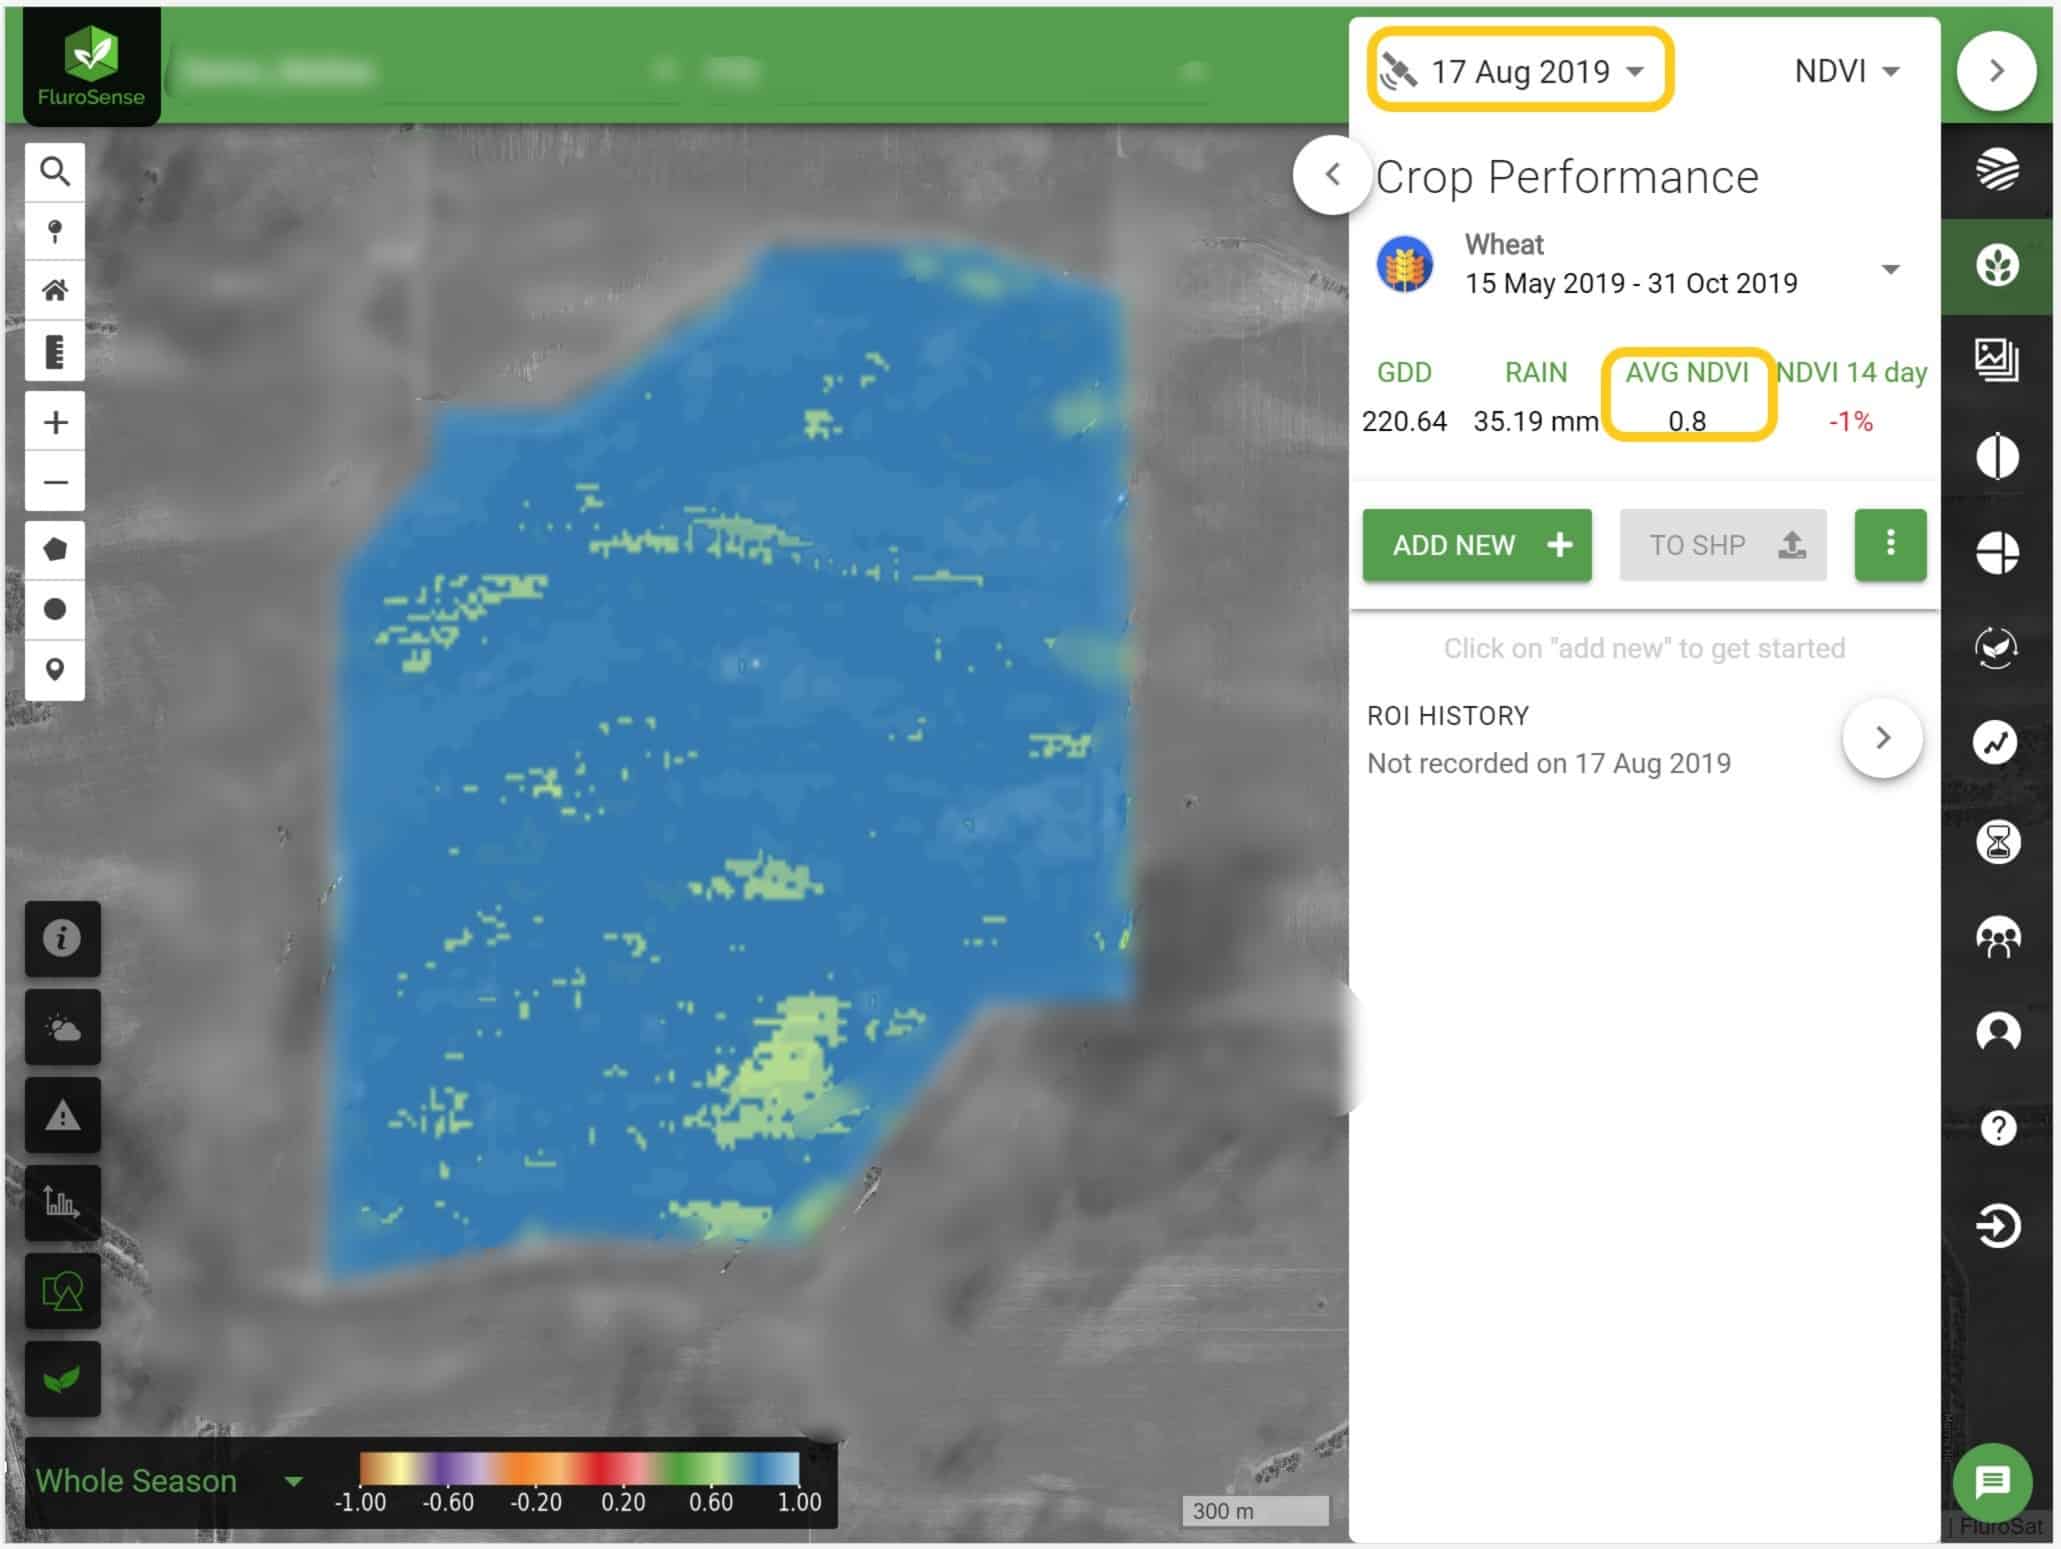
In the below example of the Mallee region, Australia, a wheat paddock was exposed to 5 consecutive days of minimum temperatures below 2-degree celsius.
The imagery (left) captured on August 17 highlighted the average NDVI crop health value of 0.8 (blue shading). Subsequent imagery (right) captured after the onset of the first frost event (started on August 24) shows the crop displayed stress with average paddock NDVI declining from 0.8 to 0.74 within a 10-day period.
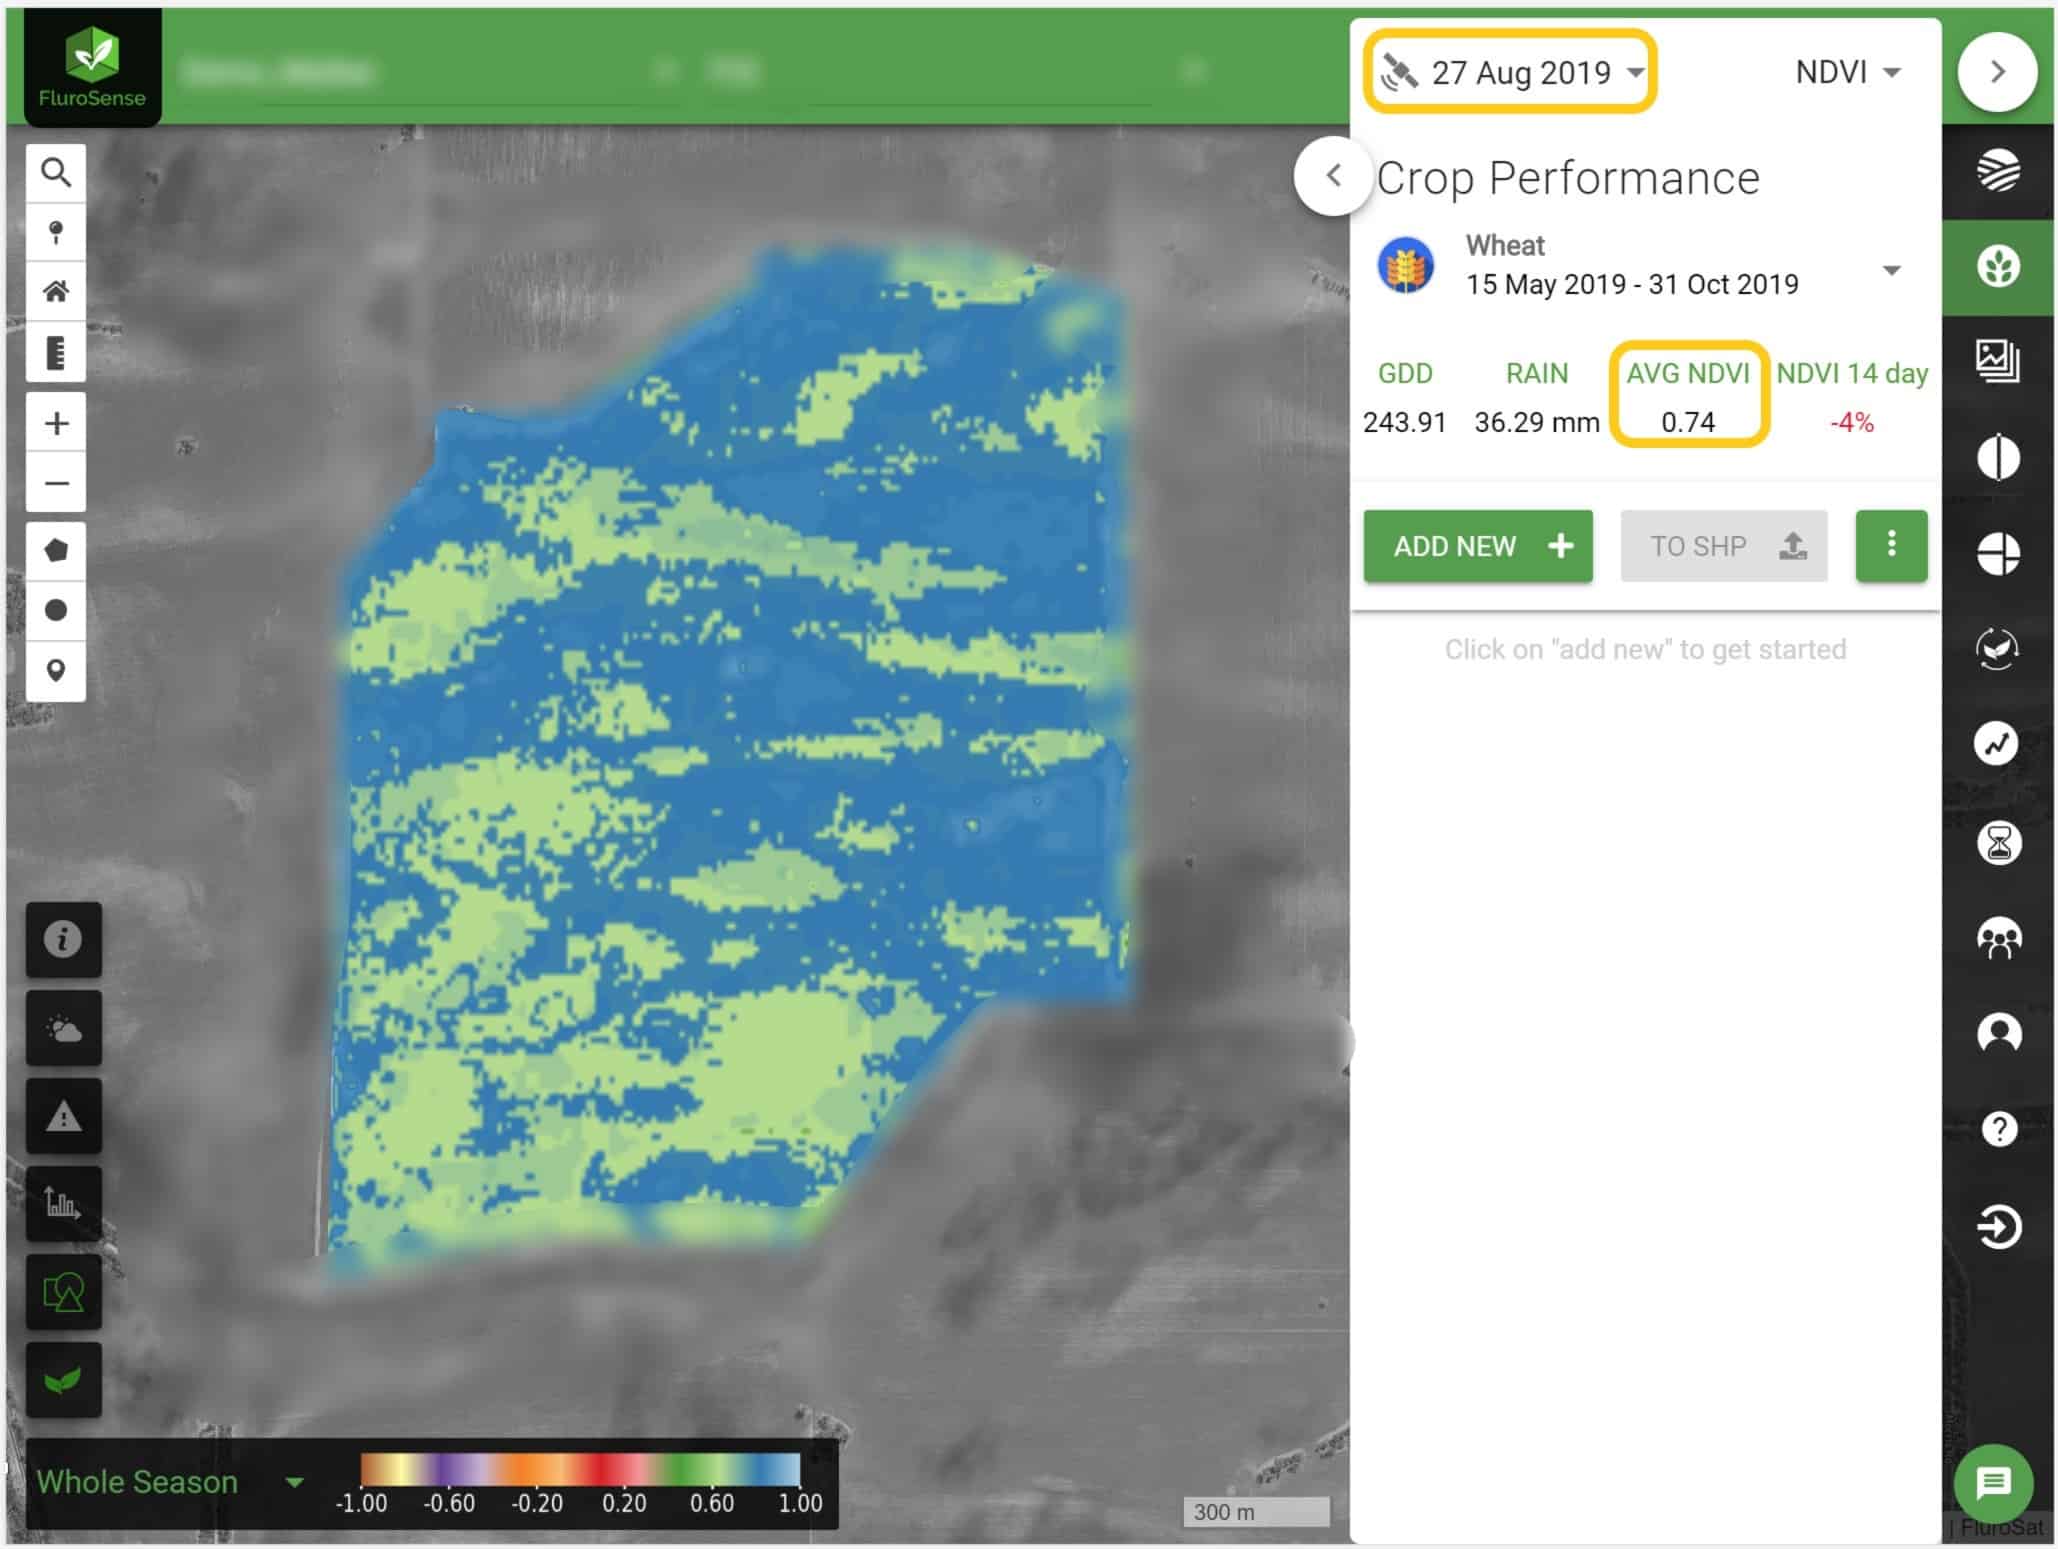
In this case, the areas of the paddock initially affected by the onset of frost stress are largely attributed to higher sand ridges that more commonly have lower nutrient/water holding capacity than the rest of the paddock.
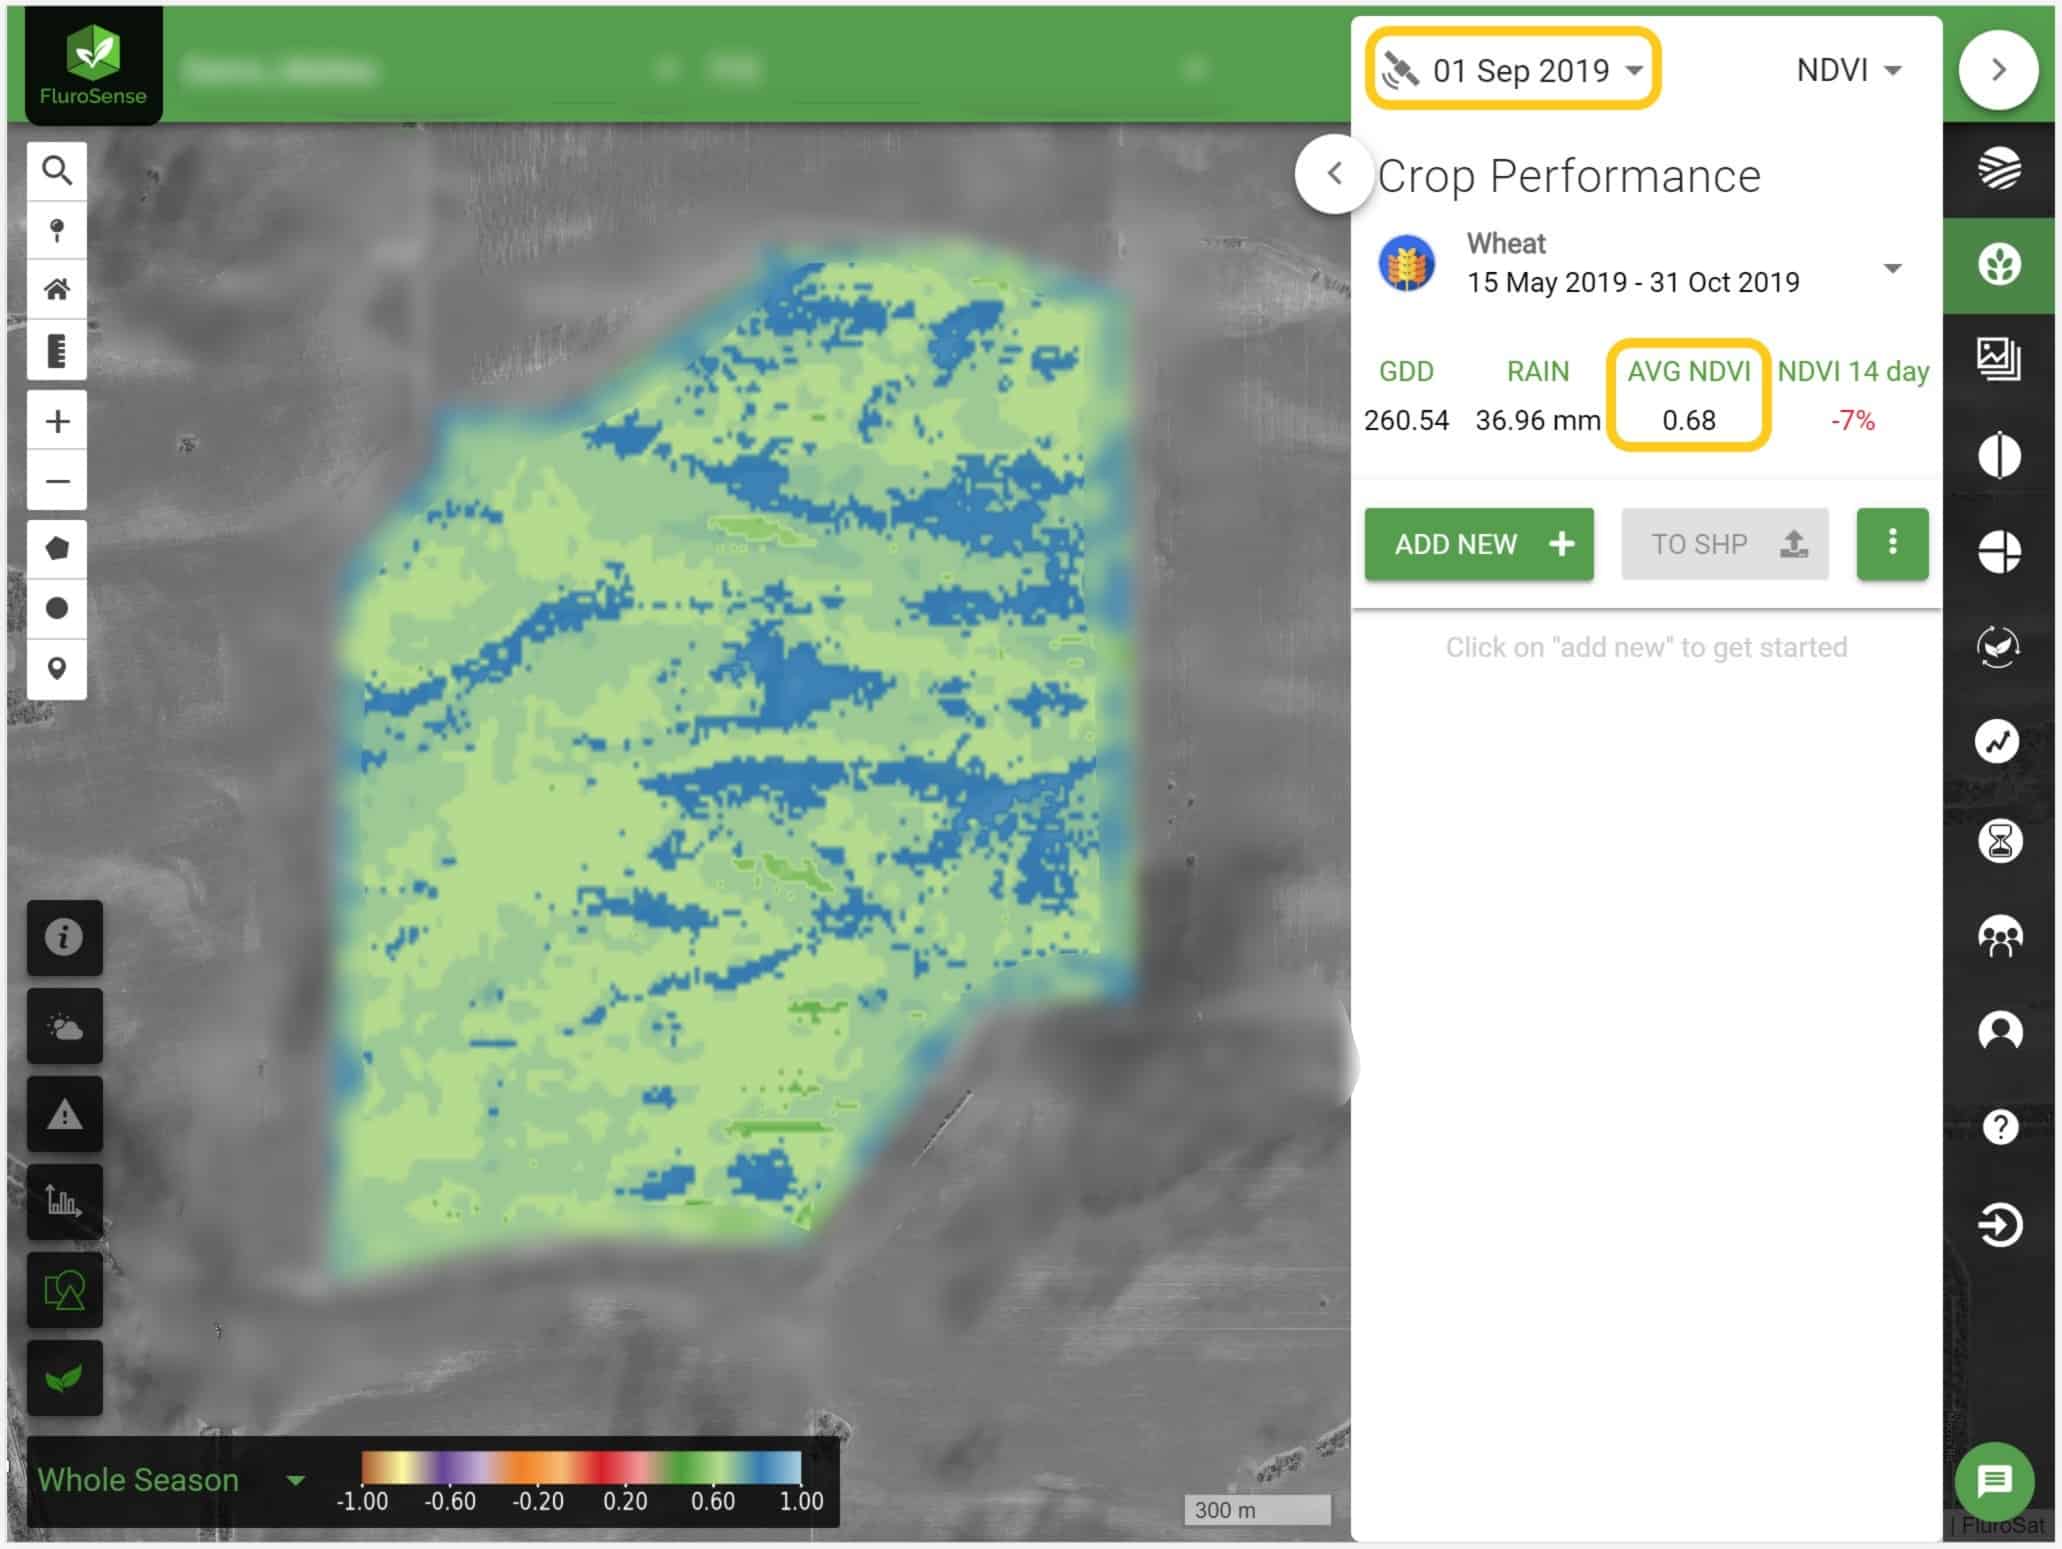
In the satellite imagery below, it highlighted a further reduction in crop performance with the average paddock NDVI declining to 0.68. This indicates the stressed nature of the crop during the exposure period.
Monitoring & tracking crop development with analytics
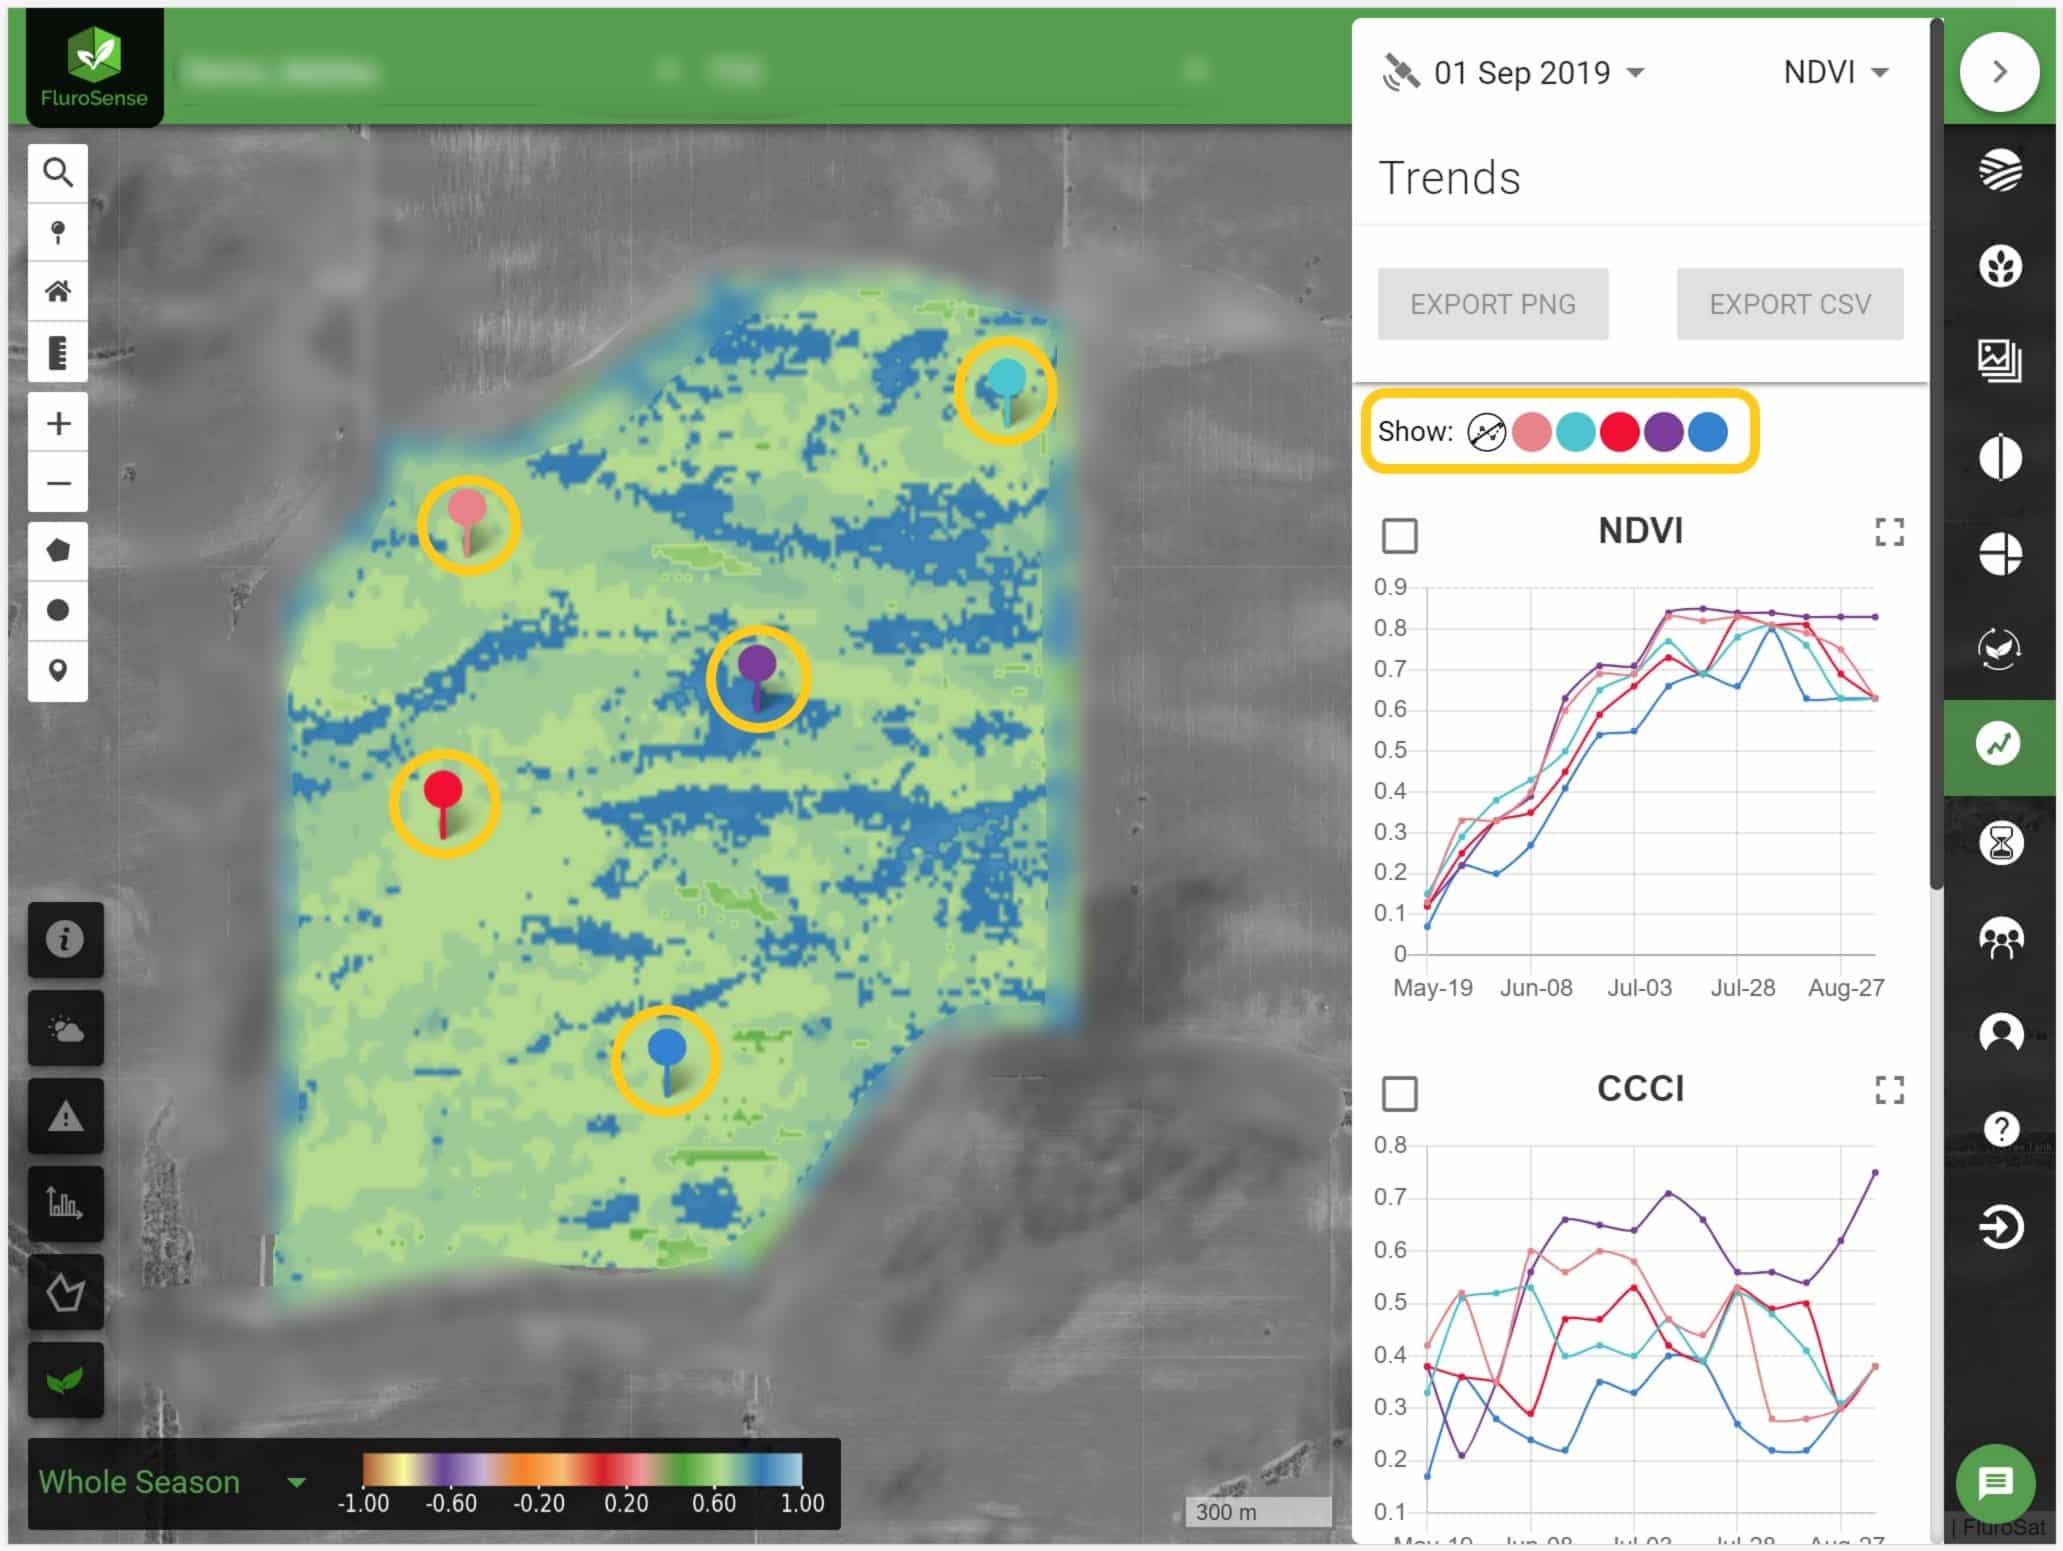
It's useful to assess pixel-based regions of interest through time-based analysis to enable accurate analysis of crop performance and development in the event of frost. A time-based analysis will help to identify areas of farms that are at risk of frost occurrences.
Area-based analytics of paddocks should also be used to track the performance of user-defined/anomaly defined areas. The below example shows a decline in the NDVI values of those pinned locations. (The red pin highlights an area of the paddock that has either not been exposed to frosts or is generally a stronger performing area of the paddock.)
Although there's no one-size-fits-all farming practice that can reduce frost impact on crops, but we can start to use data to help make an informed choice to derive the most appropriate management decision - An important decision that can determine crop yield potential under frost, whether it is progressing to harvest, use for in-situ stock feed or cut for hay.
To find out more about how you can use FluroSense to aid in your farm decision-making, contact us now.