
Contributors

Subscribe to our newsletter
At FluroSat, we started monitoring fields for this season's US cotton crops and are looking forward to applying the many insights we gained from the Australian season that has just completed. It was an important milestone for us, as we successfully converted a lot of scientific research into a practical tool for solving one of the industry’s biggest challenges - the nitrogen problem.
Originally a purely economic issue, overuse of nitrogen fertilisers in cotton has become both a social licence and regulatory problem. The pollution attributed to excess nitrate leaching is leading local and state governments to require growers to track their nitrogen applications. The additional workload this is creating will only get worse as these regulations move from monitoring towards active restriction.
The current and potential impact on the cotton industry has prompted much research into how we can improve nitrogen management. In Australia, the CSIRO and Cotton Research and Development Corporation (CRDC) has backed FluroSat to help make that research useful and actionable to growers, helping us validate our analysis and generating recommendations from our data.
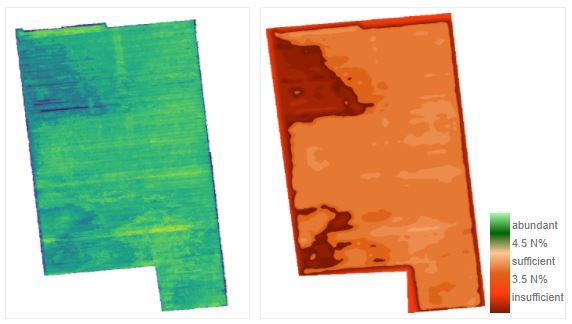
As the saying goes, “you can’t manage what you can’t measure” so FluroSat’s ability to detect nitrogen status across entire fields throughout the season is critical in solving the nitrogen problem. We analysed multi- and hyperspectral data taken by satellites, aircraft and drones throughout the season to automatically generate nitrogen maps of 14000 acres over 71 fields. As a result of this study, we discovered that our tissue Nitrogen mapping method achieves 4 times the accuracy of NDVI at the critical time of making a side-dressing decision. This means, better financial decision based on timely and relevant information.
Our data were validated against tissue sampling data taken in conjunction with our flights, which was also used to calibrate each field. Rather than relying on a few samples collected from mostly random points in the field, this calibration creates a field-wide nitrogen map that can be used to create management zones.
Aside from the respected scientists whose combined research contributed to the analysis, we worked closely with agronomists to ensure the analysis can be easily used by showing actual nitrogen content and its sufficiency (i.e.: deficient, sufficient, surplus, toxic), removing the need to interpret vegetation maps. Their advice also helped us turn the FluroSat platform into a tool that fits easily into their existing workflows - such as generating management zones they can export to VRT equipment and farm management software.
You can get a feel for how you can use the FluroSat platform for your cotton crop this season by signing up for a trial.

