Contributors
Subscribe to our newsletter
Objective: Analyse the spectral signature of different varieties to determine whether a correlation can be established and can help to better manage the irrigation of valves A and B.
Context: 4 varieties are planted on the orchard. The irrigation system is installed according to these varieties, separated into two valves A and B. A waters all the Nonpareil variety and B the 3 other varieties.
Method
Location: Hillston, NSW, Australia
Data source: Aerial imagery from the 5th of Dec 2019
Resolution: 0.45 m/px
Layer calculated: NDVI and CCCI The values from NDVI 0 to 0.2 (spaces between plots/streets) were masked, so they wouldn’t interfere with the index calculation.
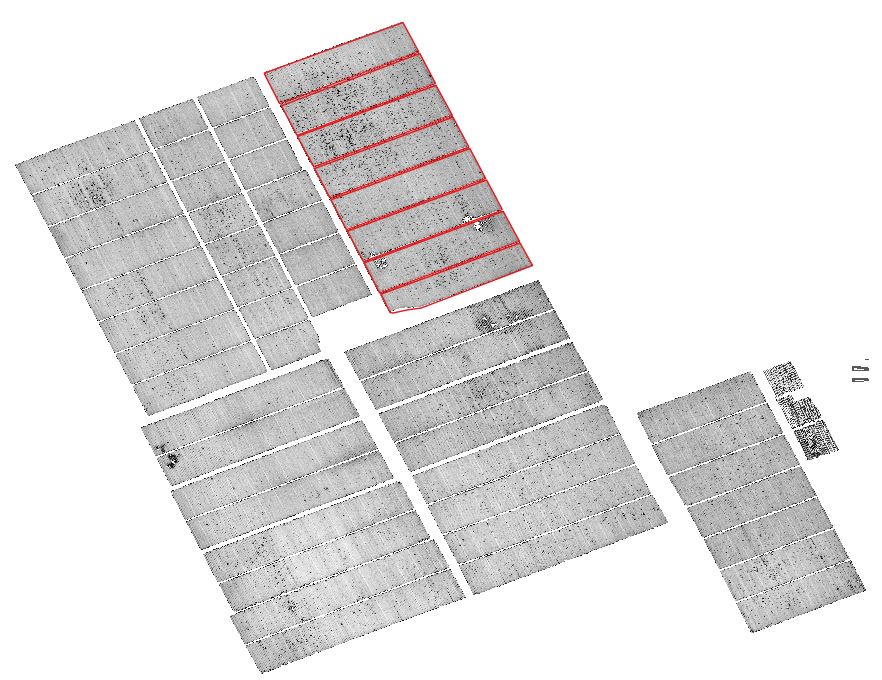
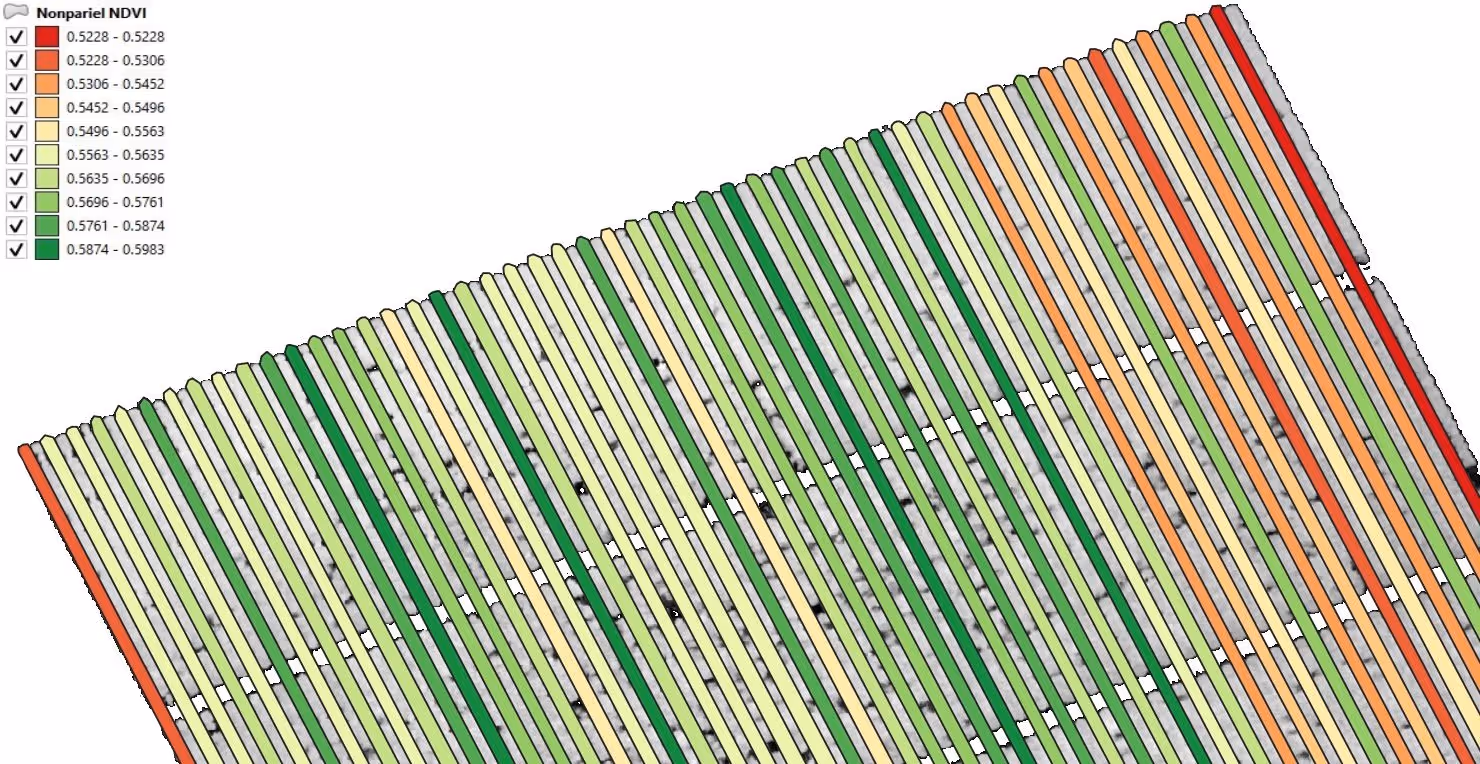
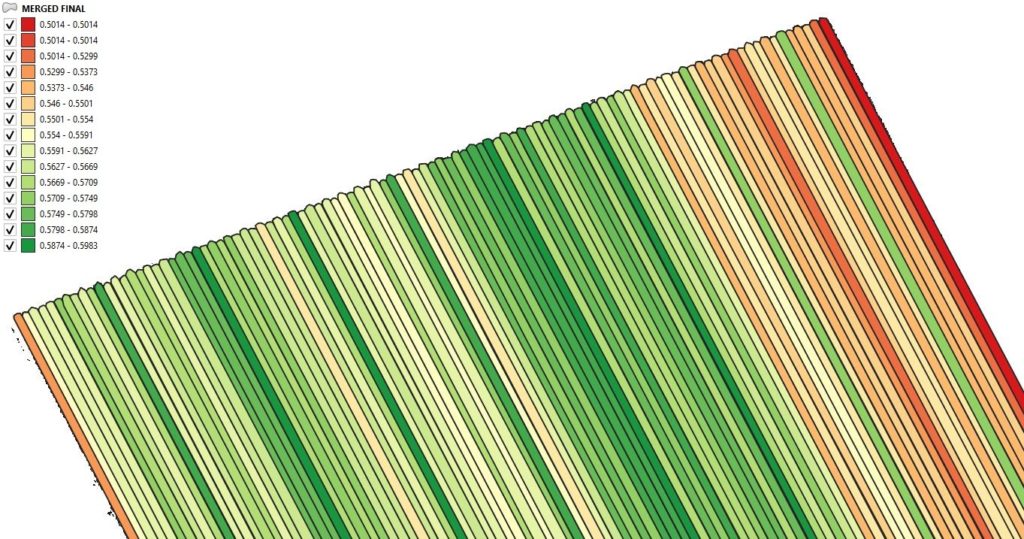
Figure 1: Map of the orchard and the field analysed in this study.
Boundaries: 100 boundaries have been drawn - one per each tree row - with the objective of analyzing them individually.
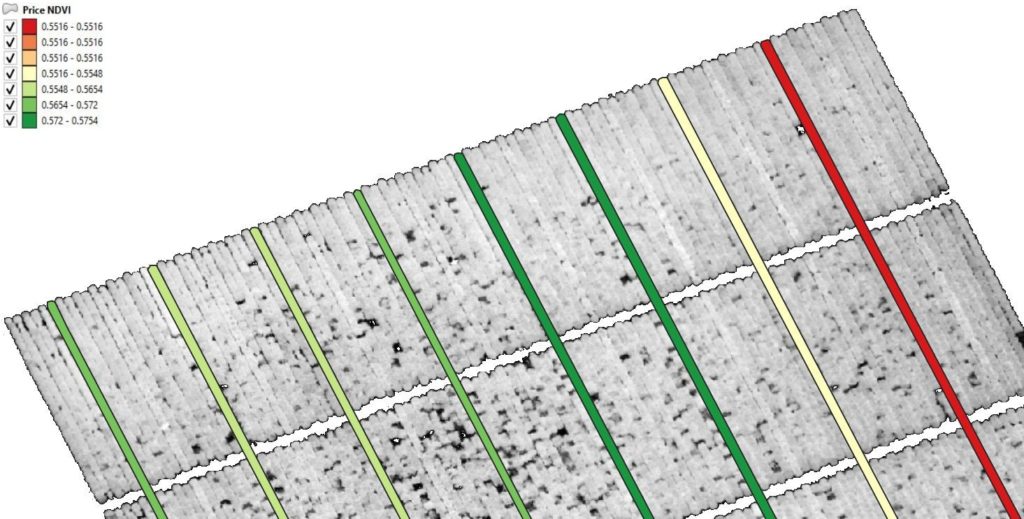
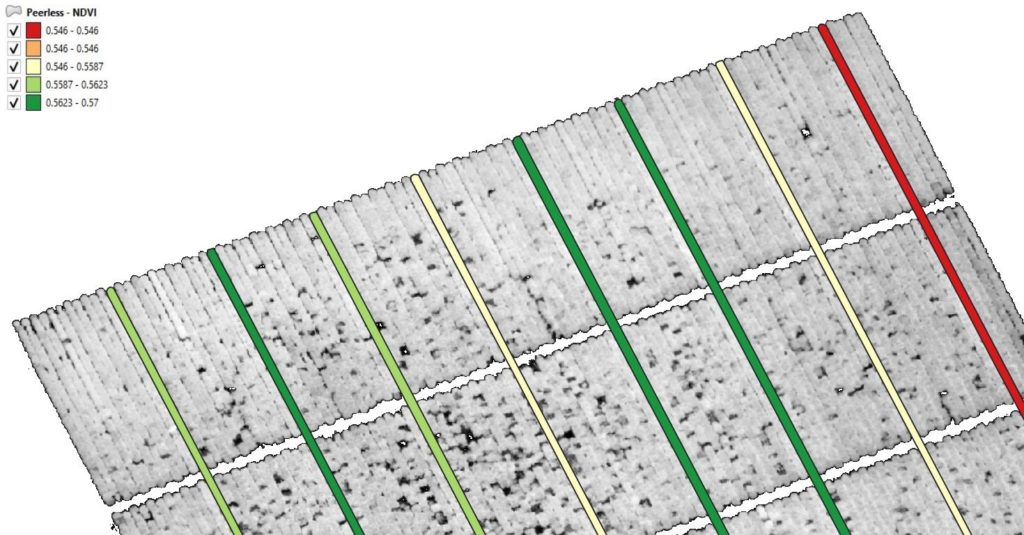
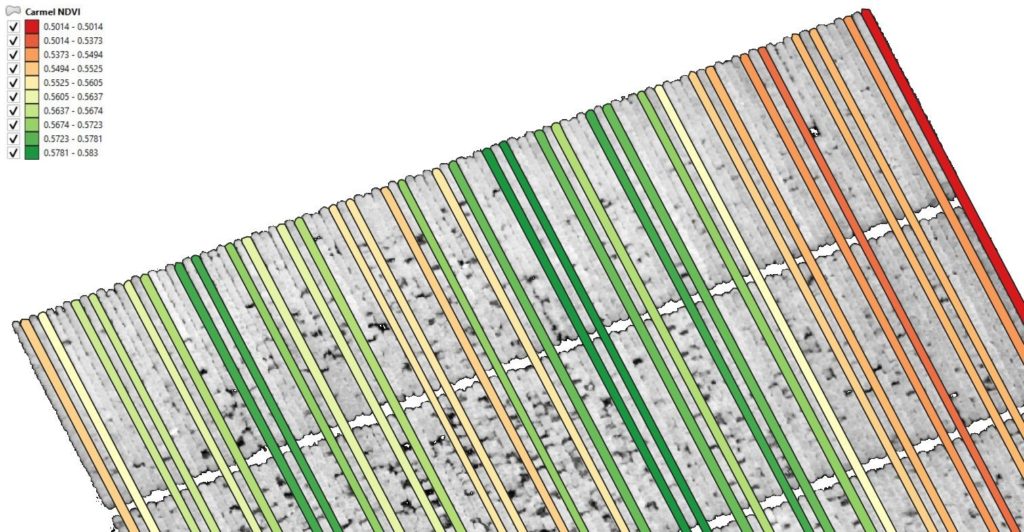
Zonal statistics were calculated for each one of the rows. Average NDVI and CCCI have been generated and the values were used to colour the rows’ boundaries.
Varieties: The almond orchard has 4 different almond varieties planted.
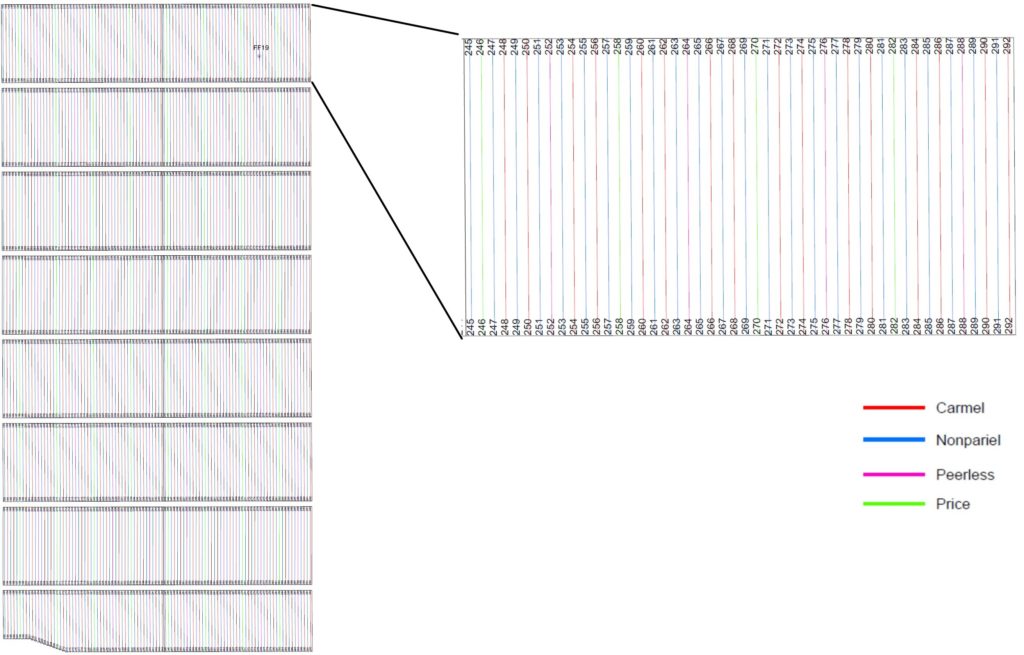
Figure 2: Map of the irrigation system and varieties on the orchard.
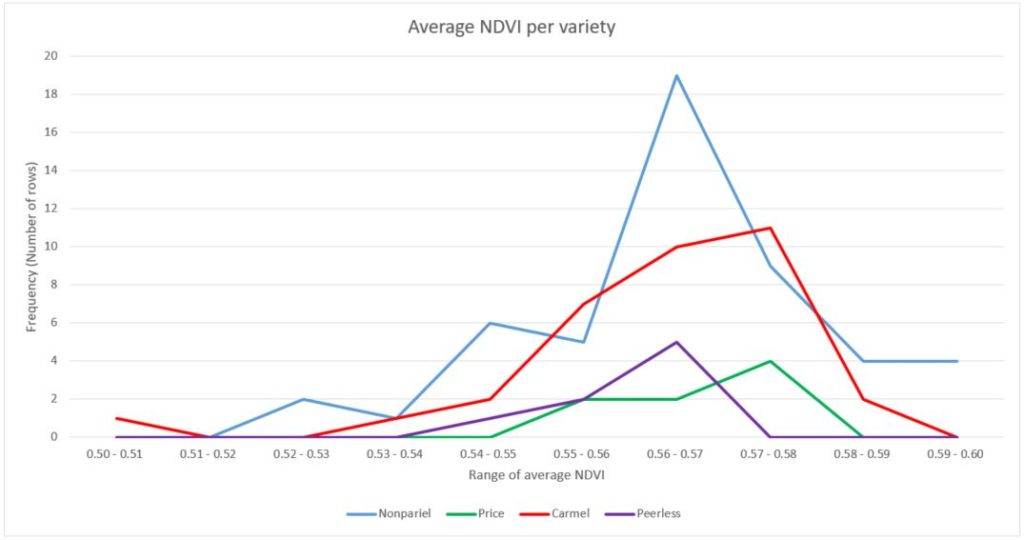
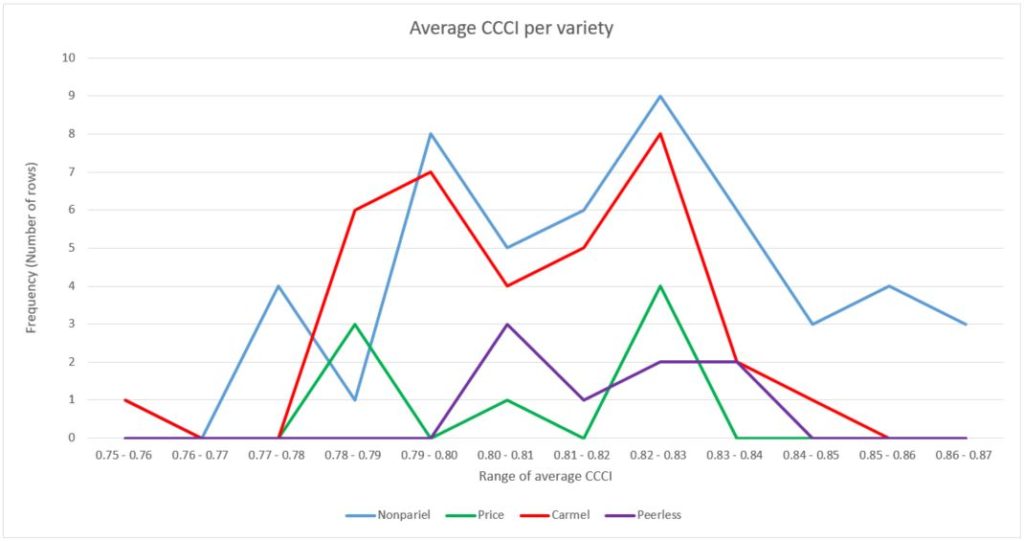
Inter - variety analysis

Results
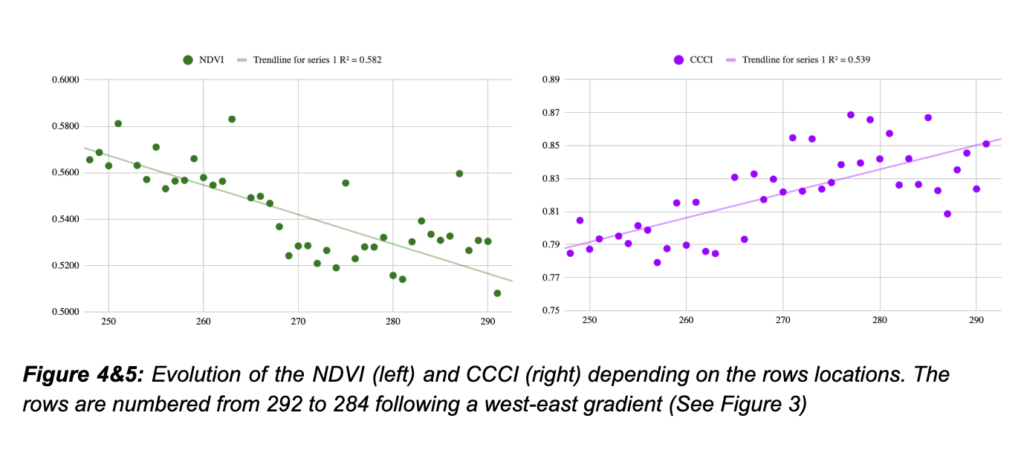
CCCI increases as NDVI decreases between rows along a west-east gradient, suggesting that something other than the variety, influences the spectral signature of the orchard.
Results show a strong effect of row location within the block with a correlation of R2 = 0.6 between row location and NDVI and R2 = 0.5 between row location and CCCI.
Under these conditions, it difficult to identify a correlation between the varieties and the vegetation indices due to an important spatial variability.
However, we can identify a pattern in the distribution of NDVI of the red varieties and blue varieties. The NDVI spectrum of the red varieties ranges from 0.78 to 0.85, with a peak at 0.78 and 0.82. While the NDVI spectrum of the bleu varieties is more diffuse ranging from 0.78 to 0.86 with 2 peaks at 0.8 and 0.86.
Conclusions
There seems that be an important gradient West-East on this block, due to a parameter independent of the variety. This variability could be due to different parameters such as soil type or location of the irrigation pumps (closer to the pump - higher water pressure - higher NDVI?).
However, a spectral signature has been identified between red and blue varieties and could be used to differentiate varieties and ultimately monitor separately the irrigation.
In order to conclude this analysis and validate the possibility to use remote sensing imagery to monitor varieties, this study would need to be extended to other dates and location to get rid of the spatial effect.