Contributors

Subscribe to our newsletter
Detect. Export. Apply.
Use the zoning tool to split your fields into different management zones based on their crop performance. Create site-specific management plans with tissue sampling points, then export for in-field application.
Time to read: 2mins
Selecting your zoning method

There are a number of statistical models you can use to map zones in your field. To begin, choose a zoning method from below:
- Standard Deviation:
- Shows you how much a feature's attribute value varies from the mean.
- Equal Records:
- Classifies data into a number of categories with an equal number of units in each category.
- Equal Interval:
- Sets the value ranges in each category equal in size. The entire range of data values (max-min) is divided equally into the number of classes that have been chosen.
- Best Fit Jenks:
- Determines the best arrangement of values into different classes. This is done by seeking to minimize each class’s average deviation from the class meanwhile maximizing each class’s deviation from the means of the other groups.
- Custom method:
- Allows you to modify the zones around specific ranges of index values. Choose the number of zones you want to create and use the slider to set up the index value for each range.
Configure your Zones
Next, select the number of Variable Rate Zones. By specifying the Minimum Zone Area, you can customize the smallest area of zone mapped field to ensure you see only significant data.
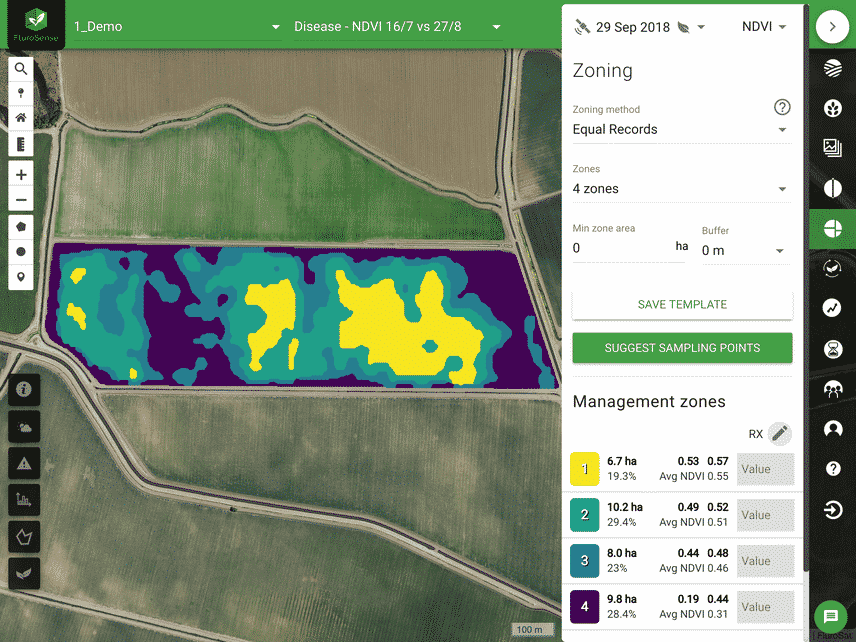
Finally, use the Buffer to remove the anomalous areas that often surround the field (like fences or roads).
Sampling Points
Use the sampling point tool to automatically choose sampling points. Click and drag to point to move them to other areas of your field as needed.
Generate site-specific fertiliser recommendations for your field
Input your desired Rx (Fertiliser Recommendation) for each zone. The higher the reflectance score, the healthier the crops. Zone 1 has the lowest reflectance; hence you should prescribe in descending order (more to Zone 1 than Zone 4).
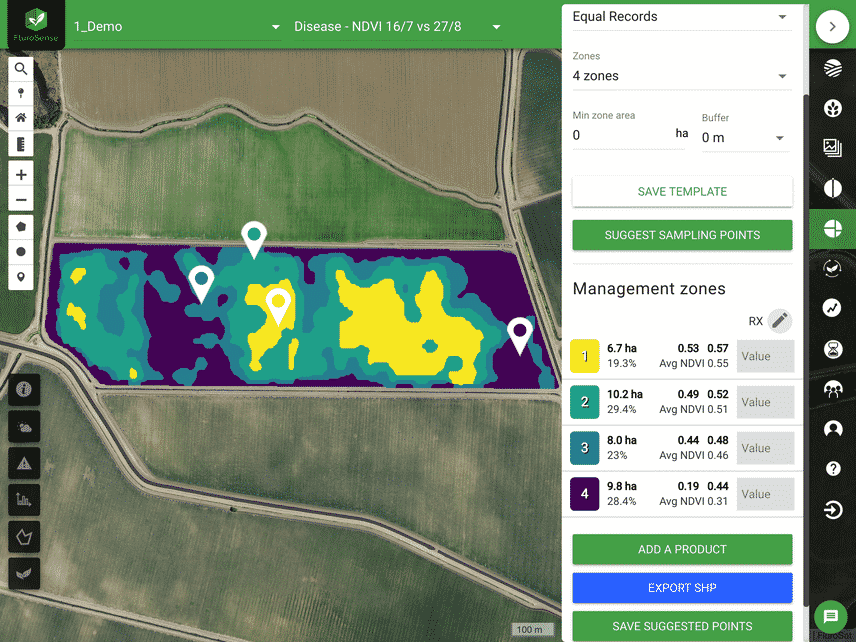
Downloading the SHP allows for you to import the file into your variable rate machinery.
The shapefile output can be used to create variable rate maps for field application of, for example, fertilizer. The shapefile marks areas of lower N, and so, this map is used to direct more N to those areas.
Shapefiles can also be logged in to your Farm Management Software to store more data. You can see progress in aspects including soil restoration and water stress, to find solutions that are working the best for your fields.
Support
Need help? Have a question? Fill out this short form and our team will contact you directly.