Contributors

Subscribe to our newsletter
Beverage companies Carlsberg and Heineken have committed to reducing emissions 30% by 2030, and as breweries, barley production constitutes a major percentage of their Scope 3 emissions. Emissions, determined in large part by how and where barley is grown, are consequently a key sourcing criteria alongside price, quality and availability.
Yet the way many companies bring emissions into sourcing decisions - relying on national-level averages or spotty supplier data - can lead to missteps when it comes to hitting emissions targets.
Let’s consider France, one of the world’s largest barley producers. The chart below shows French barley’s annual emissions factors (EF): the average greenhouse gases emitted per unit of crop output (here, kg CO₂e per kg barley), accounting for fertilizer use, field operations, soil processes, and other inputs.
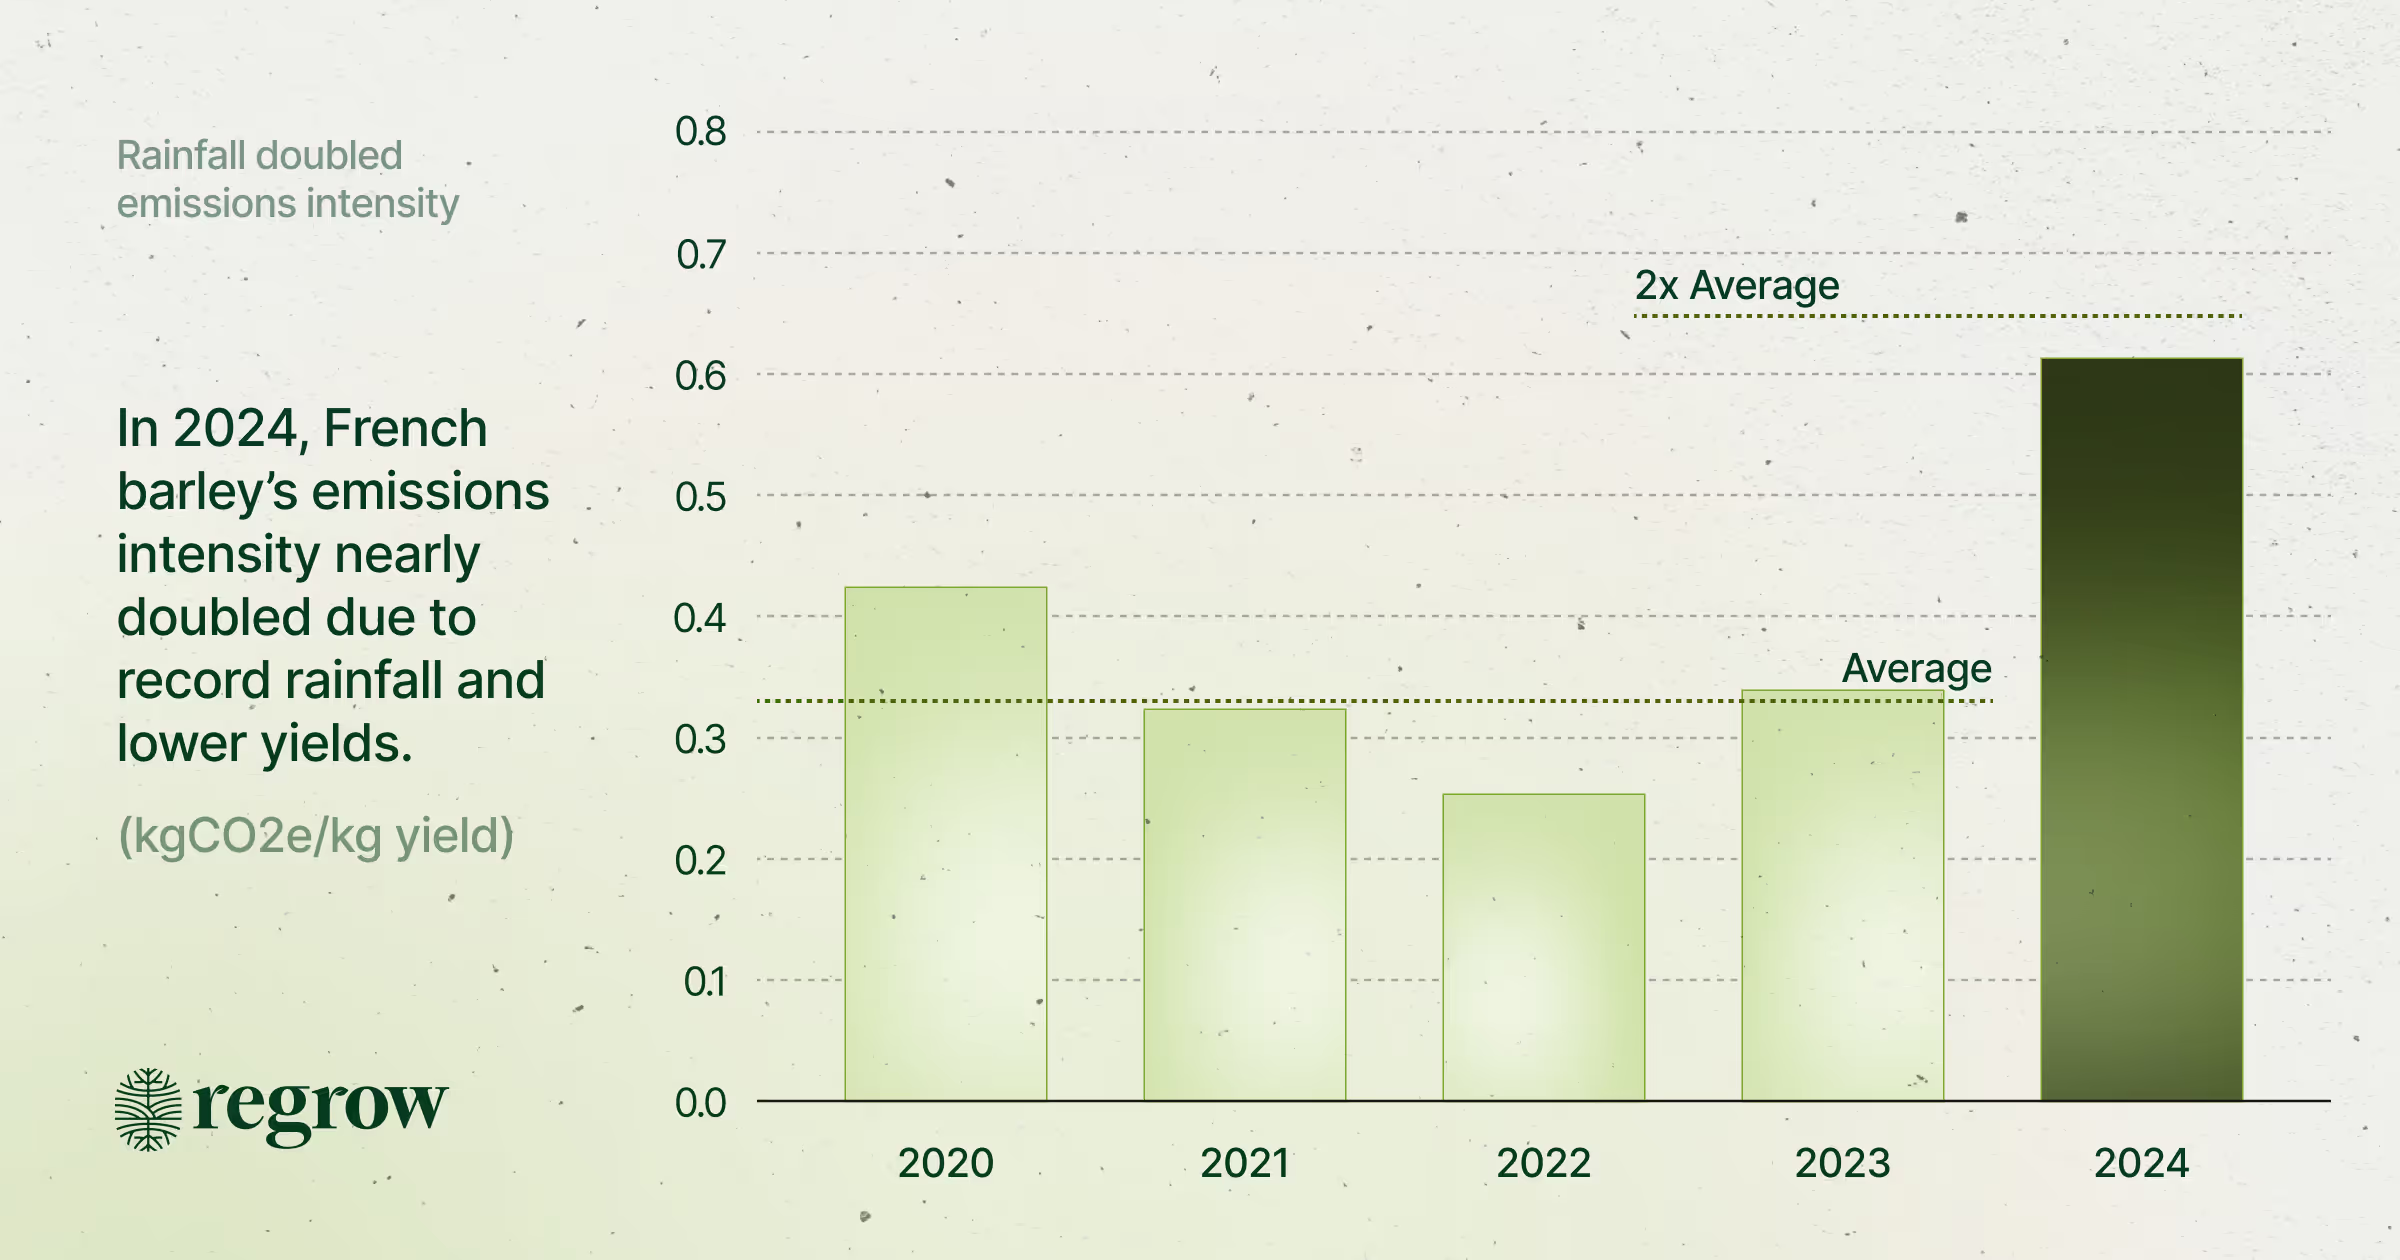
2024 was a tough year for French barley growers. Record-setting rainfall in 2023–2024 disrupted planting and decreased yields. French farmers harvested less grain using the same inputs, meaning the same emissions were spread over less barley. Aside from lower yields, excessive rainfall left soils waterlogged and anaerobic, converting much of the fertilizer’s nitrogen into nitrous oxide. This is why emissions intensity nearly doubled for French barley in 2024.
For procurement and sustainability teams at major beverage companies, this data might suggest shifting barley sourcing from France to other producers, like Germany.
But there’s one problem.
National averages like those in the chart above ignore the impact of different soil types, weather patterns, and agricultural practices within each country. These factors can dramatically affect emissions from field to field, making country-level EFs a coarse measure for companies like Carlsberg and Heineken making sourcing or sustainability investments.
We analyzed millions of hectares of French barley to unpack the local nuances these country-level EFs miss. We found that country-level EFs mask field-level variations by well over 80%, which can mean the difference between hitting or missing climate targets.
The Hidden Costs of National Averages
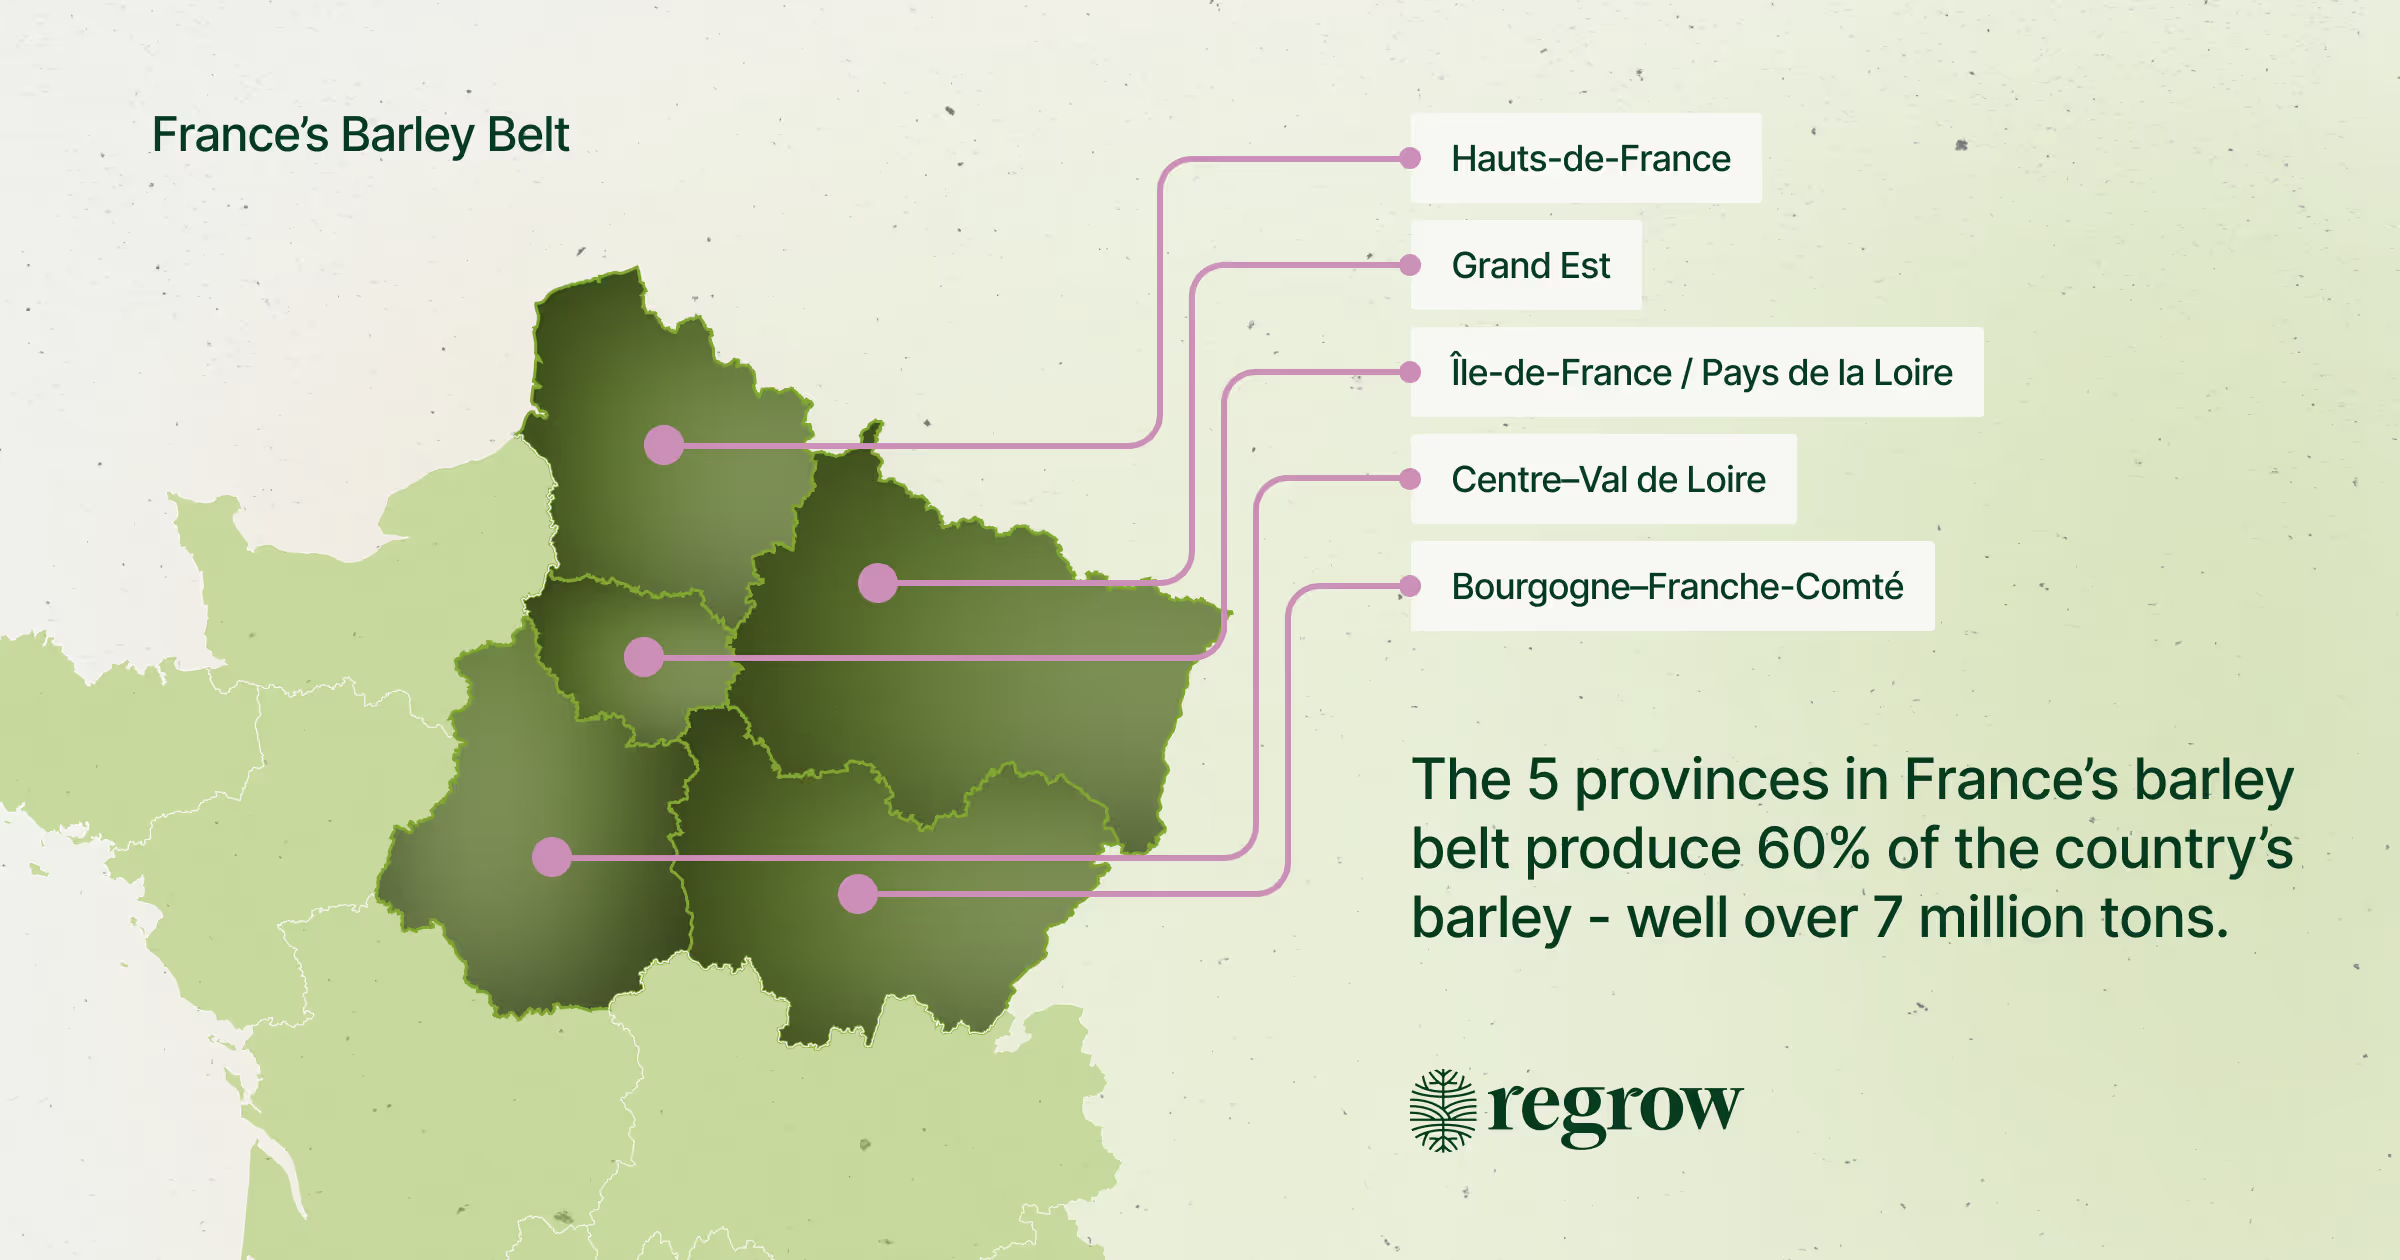
To understand the local nuance, we examined emissions factors at a more granular, regional level. The five regions on the map above represent France’s “barley belt,” where 60% of the country’s barley is grown:
- Grand Est
- Centre–Val de Loire
- Bourgogne–Franche-Comté
- Hauts-de-France
- Île-de-France/Pays de la Loire
Regrow’s data shows that in 2024, four of the five regions had emissions factors lower than France's national average, with a difference of 83% between the lowest- and highest-emitting regions.
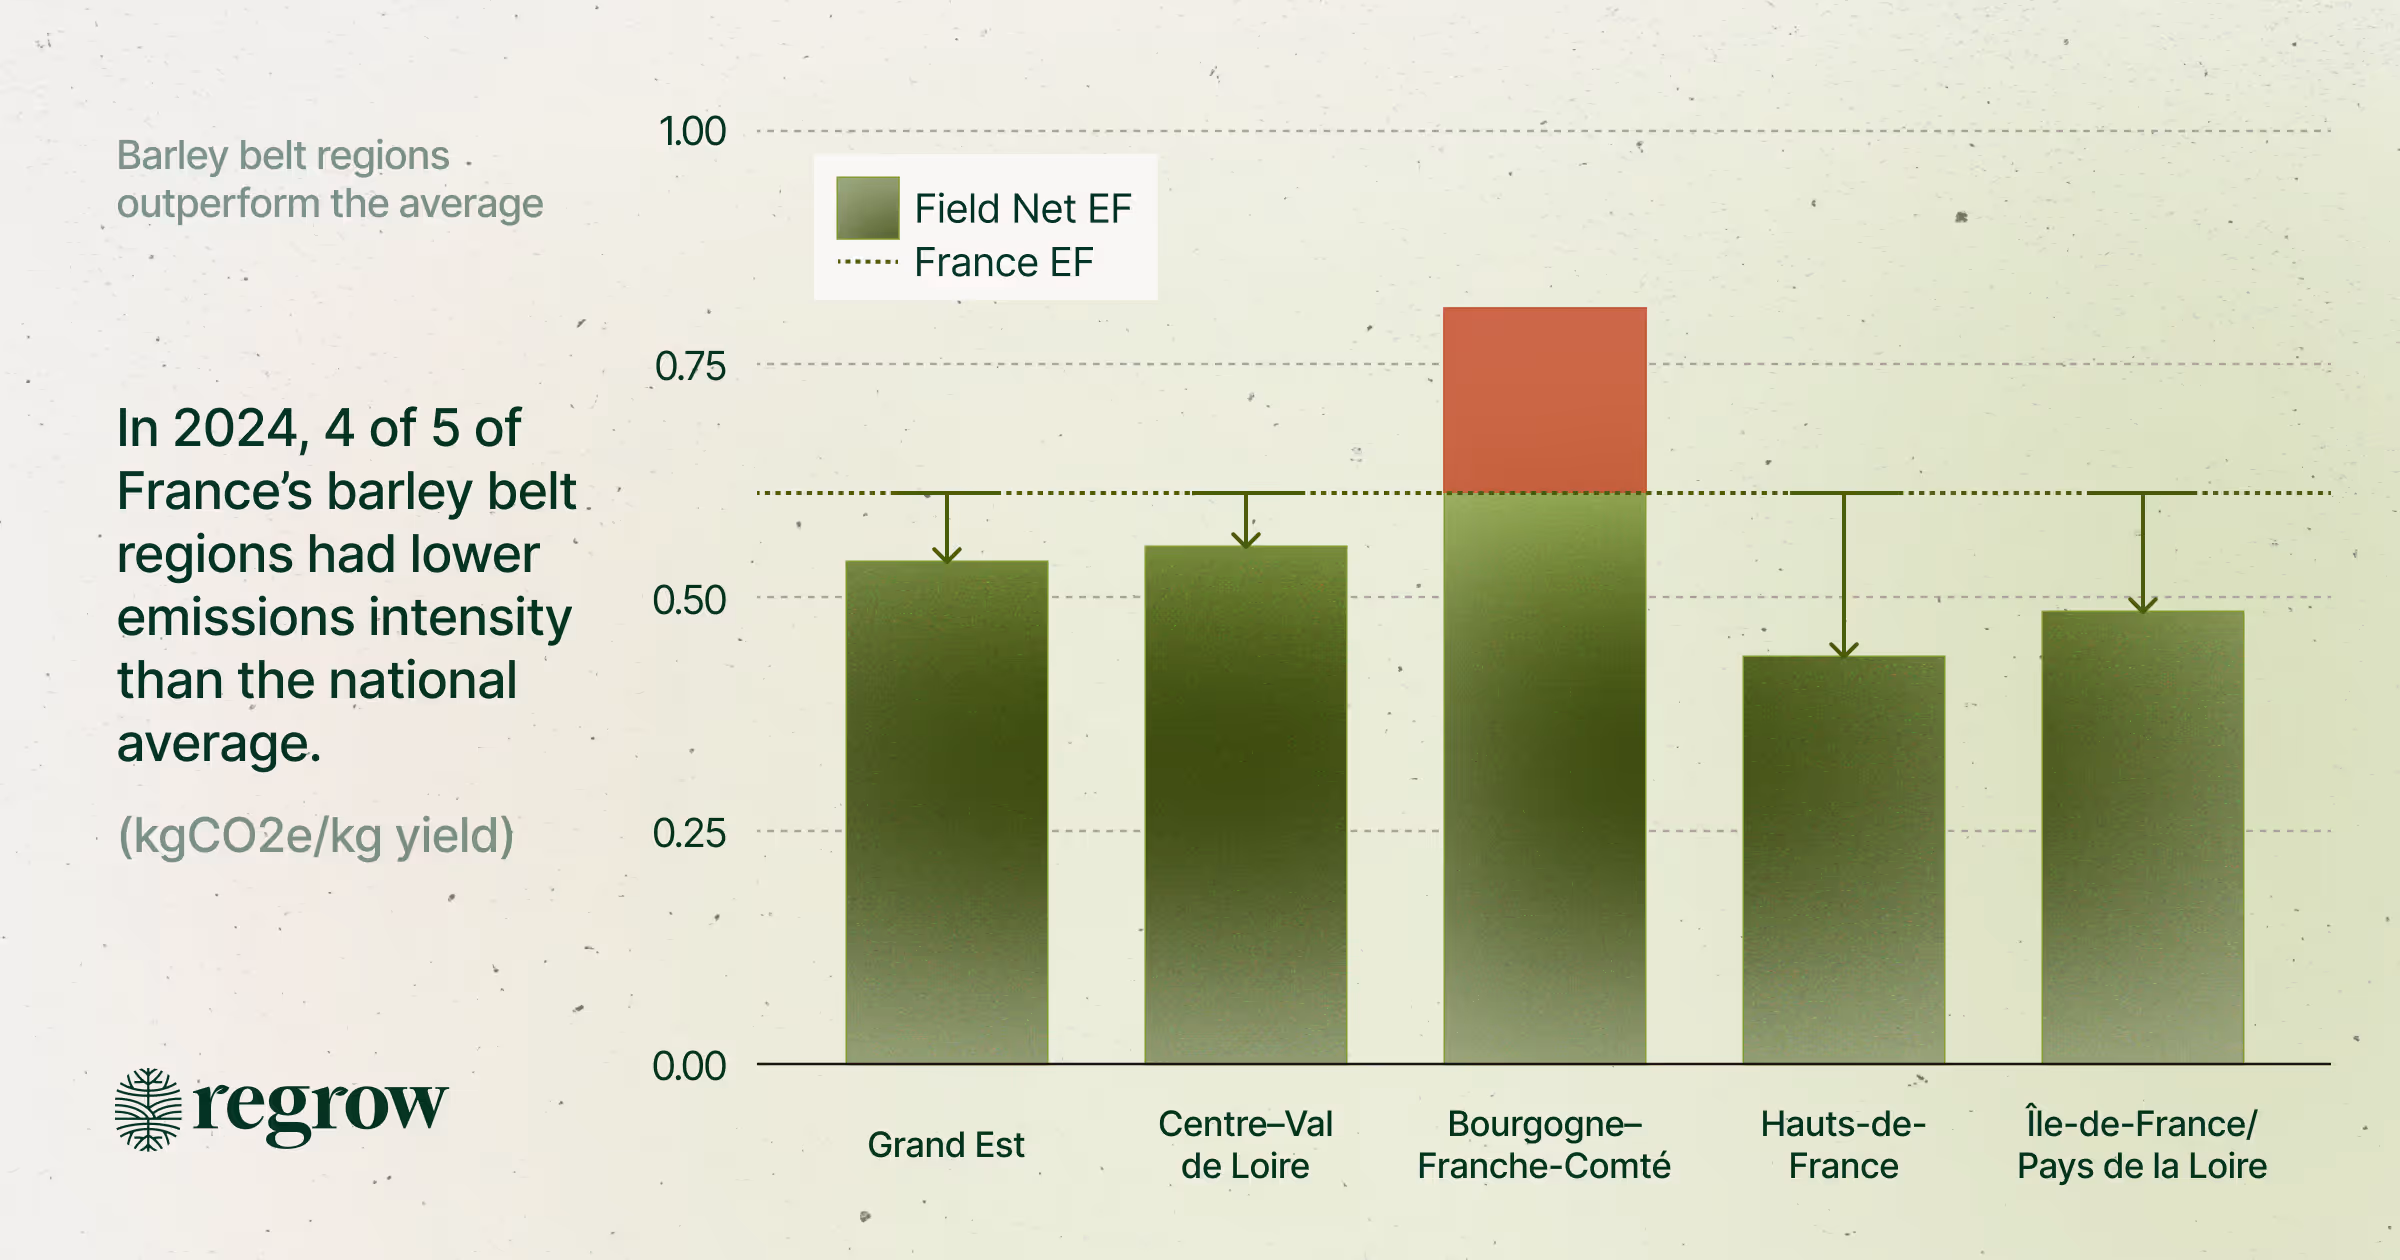
In practical terms, a procurement team using France’s country-level EF while sourcing from Hauts-de-France could be overstating their emissions by 28%.
Alternatively, choosing Bourgogne barley suppliers over Hauts-de-France could lead to an 83% increase in emissions.
But the value of field-level data goes beyond sourcing decisions. It also enables sustainability teams to design effective regenerative agriculture programs.
What impact could regenerative agriculture have in France’s barley belt?
Because barley is such a large share of brewers’ scope 3 emissions, sustainability teams are looking not just for optimal sourcing. They're looking for ways to promote and incentivize regenerative agriculture to further reduce emissions and meet their emissions targets.
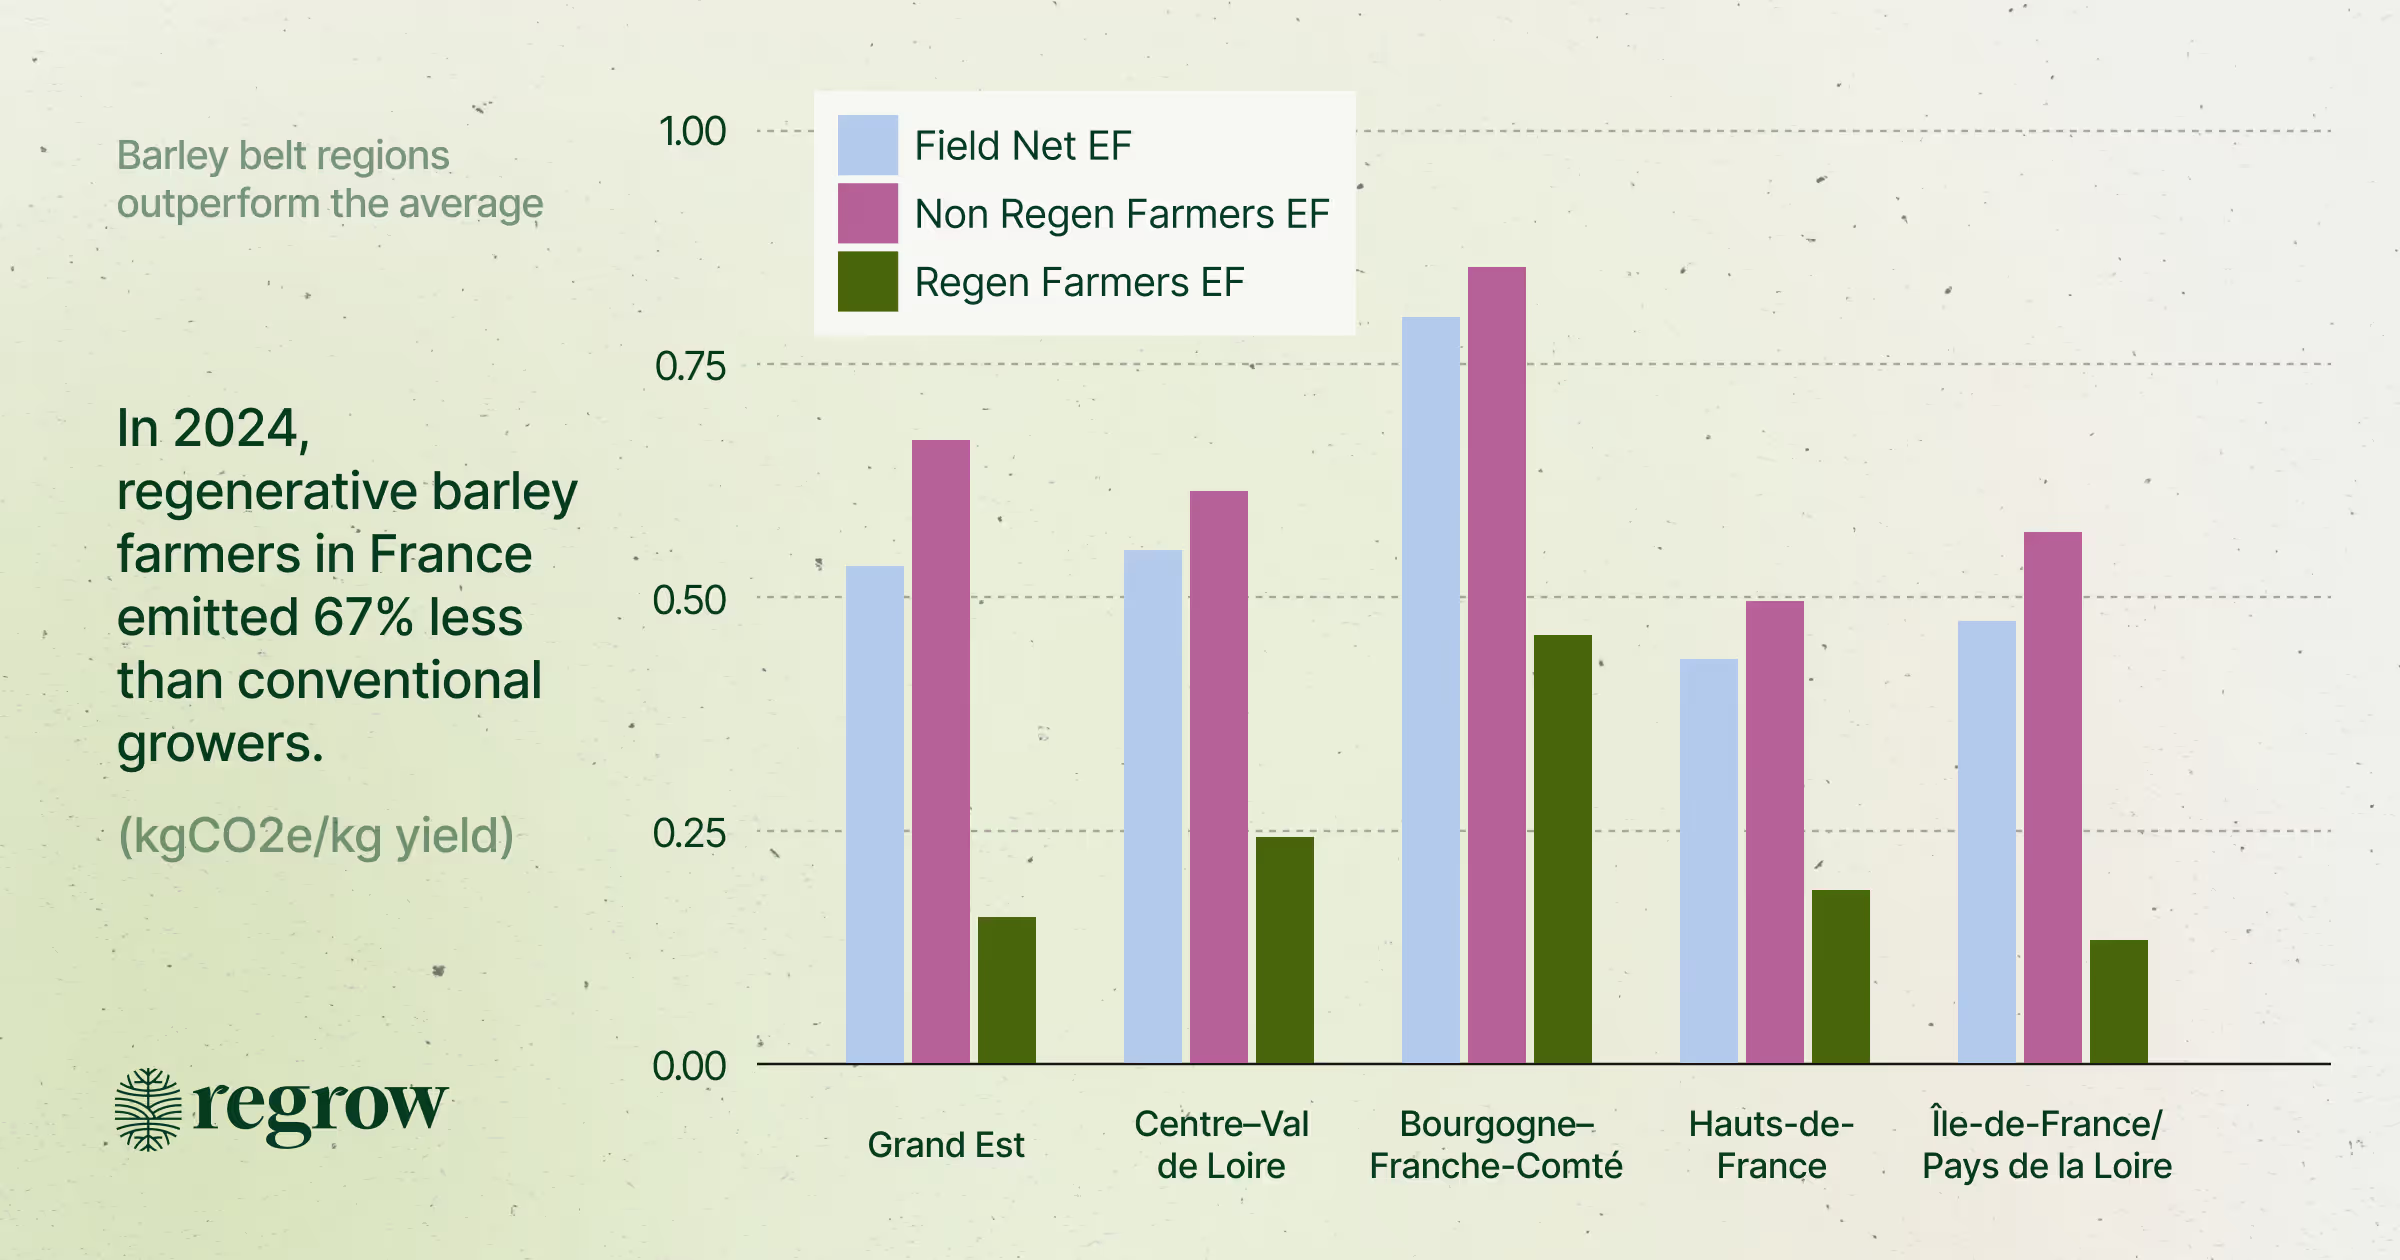
Using the same 1M+ hectares of French barley, we took a deeper look to understand if regenerative farming can significantly decrease emissions.
For the five regions in France’s barley belt, we used Regrow’s Data Scenarios feature to create two grower profiles:
- Regenerative barley farmers (defined as practicing both cover cropping and reduced/no till), and
- Conventional barley farmers (defined as no cover crop and conventional tillage)
In 2024, regenerative barley farmers achieved an average 67% reduction in emissions compared to farmers using conventional practices (even during a year with record rainfall). Looking at France as a whole, barley sourced from regenerative farmers in the barley belt exhibited emissions factors almost 80% lower than the national average.
What This Means for Your Procurement and Sustainability Strategy
Across the 1M+ hectares in the five barley belt regions, we see tremendous abatement potential from scaling regenerative practices. Yet only 11% of these hectares fall into the regenerative grower profile above. This is a huge opportunity for anyone sourcing barley from these regions.
Carlsberg, for example, needs to cut about 275,000 tons of CO₂e every year to stay on track for its 2030 climate target. If just half the non-regenerative barley hectares in these five key French regions adopted regenerative practices, the shift would abate ~69,000 tons of CO2e annually. That's roughly a quarter of Carlsberg’s yearly reduction target, from a single crop in a single region.
This case study reveals three critical insights for sustainability and procurement teams.
1.) Field-level data reduces sourcing risk
Country-level averages can be misleading. This past year in France, neighboring regions differed in emissions by more than 80%, meaning you can significantly overstate (or understate) your emissions. Without field-level visibility, sourcing and investment decisions rest on incomplete, potentially misleading information.
2.) Sustainability is a long game.
A supplier showing higher emissions this year (due to unusually high rainfall) might actually be your most sustainable long-term partner. Understanding the story behind the numbers prevents costly supplier relationship mistakes and provides context to the numbers you’re using to make business-critical investments.
3.) Regenerative agriculture delivers.
Even in a difficult 2024 growing season, regenerative barley farmers in France:
- Achieved 67% lower emissions than conventional farmers
- Produced barley 80% less carbon-intensive than the French national average
This is measurable, verifiable impact, and there’s an opportunity to replicate these results at scale.
Ready to learn what emissions look like in your sourcing regions? Regrow's field-level emissions data helps teams from 40% of the largest food and agriculture companies map, analyze, report, and act on emissions in their supply chains.